 9
9peptides
spectra
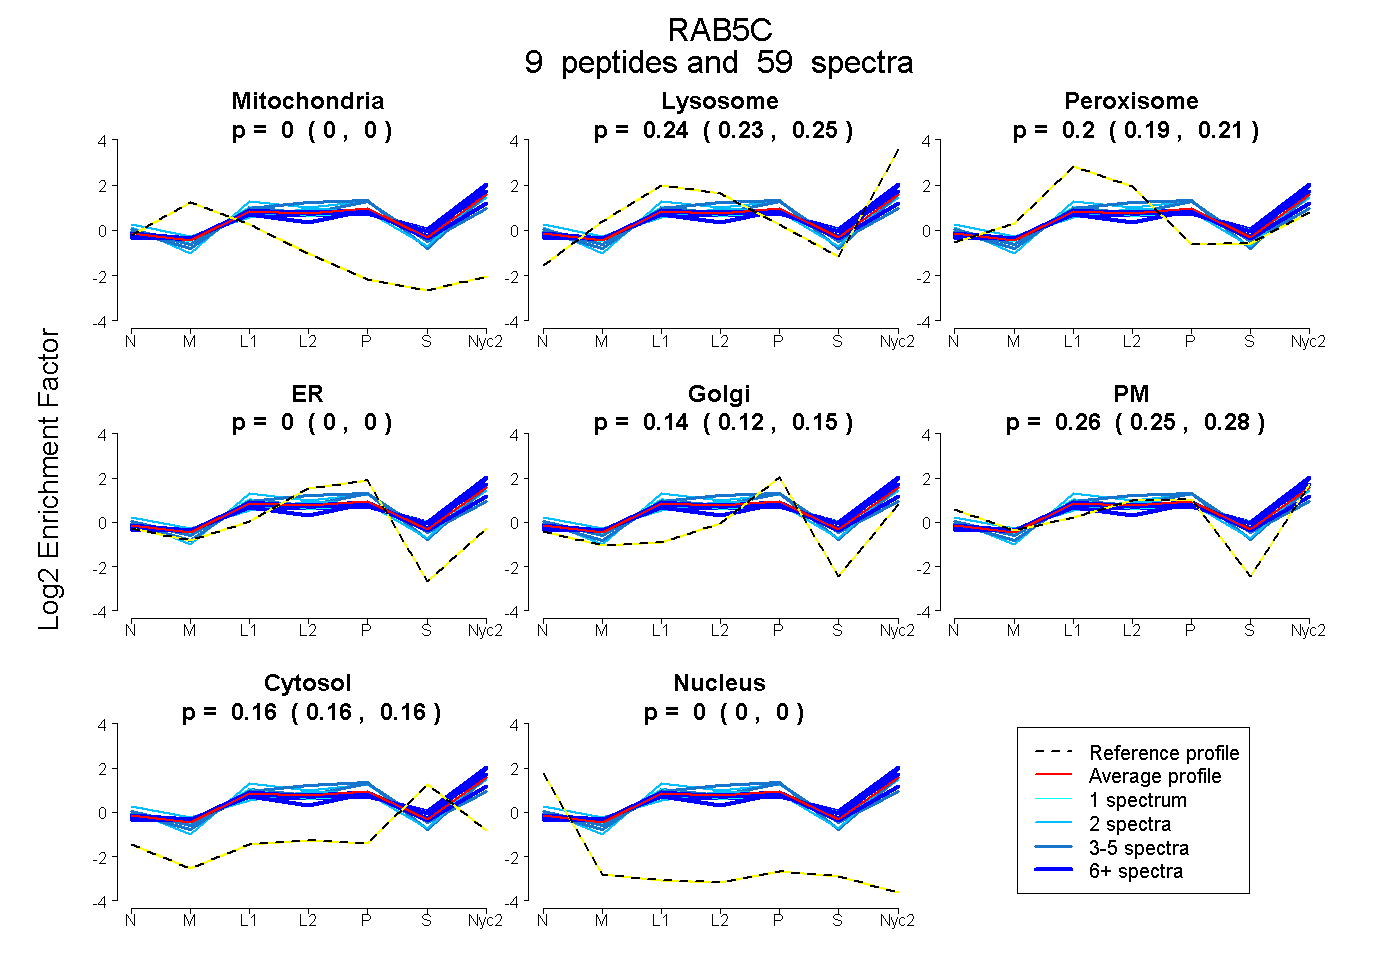
0.000 | 0.000
0.230 | 0.250
0.187 | 0.208
0.000 | 0.000
0.123 | 0.149
0.248 | 0.276
0.156 | 0.165
0.000 | 0.000
5peptides
spectra
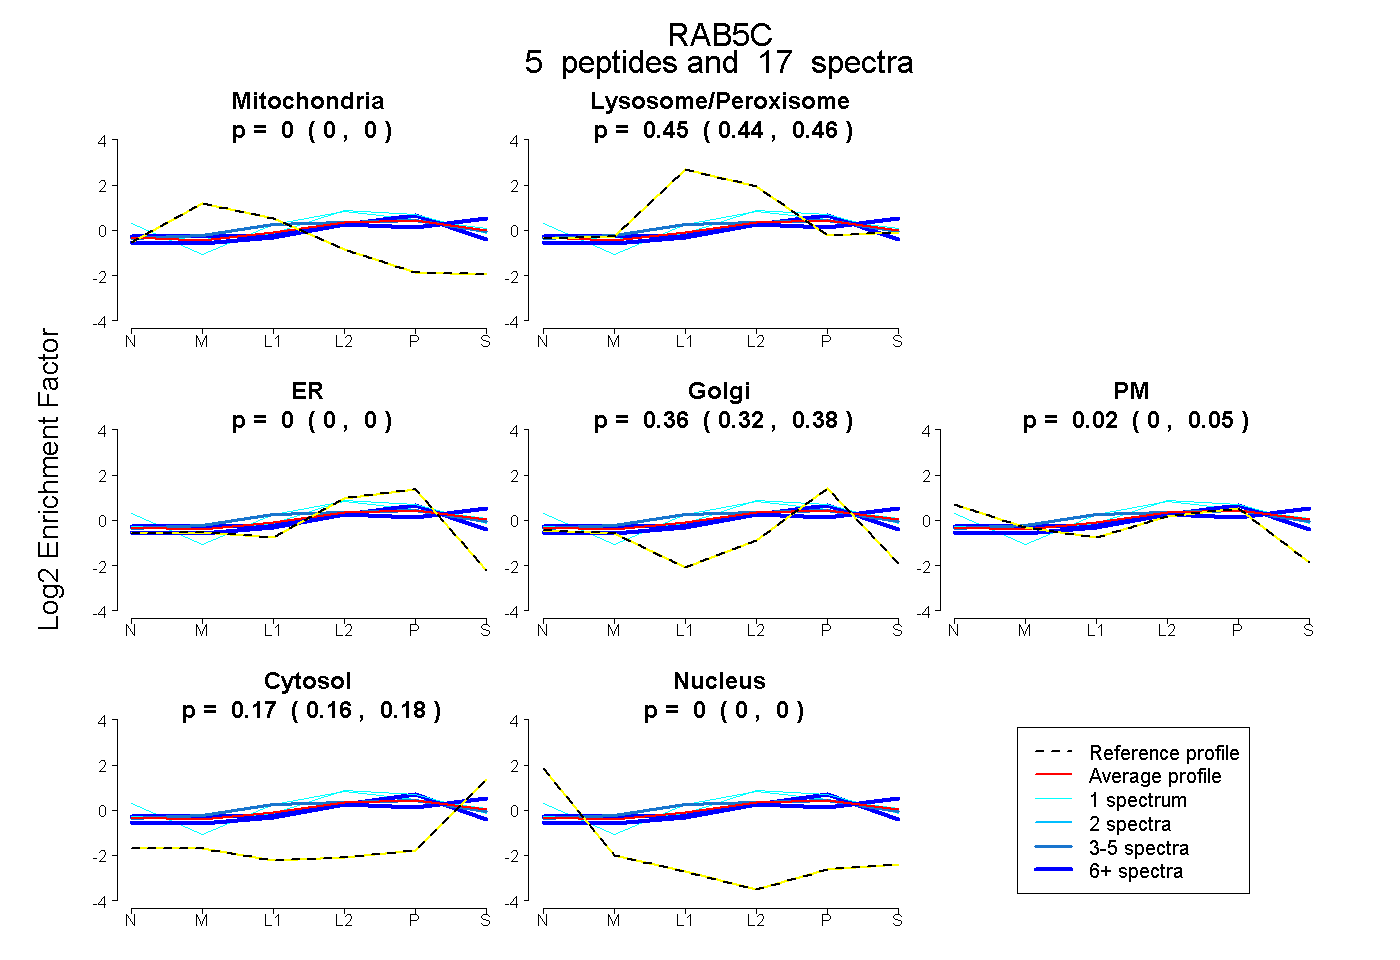
0.000 | 0.000
0.435 | 0.465
0.000 | 0.000
0.321 | 0.379
0.000 | 0.054
0.158 | 0.185
0.000 | 0.000
6peptides
spectra
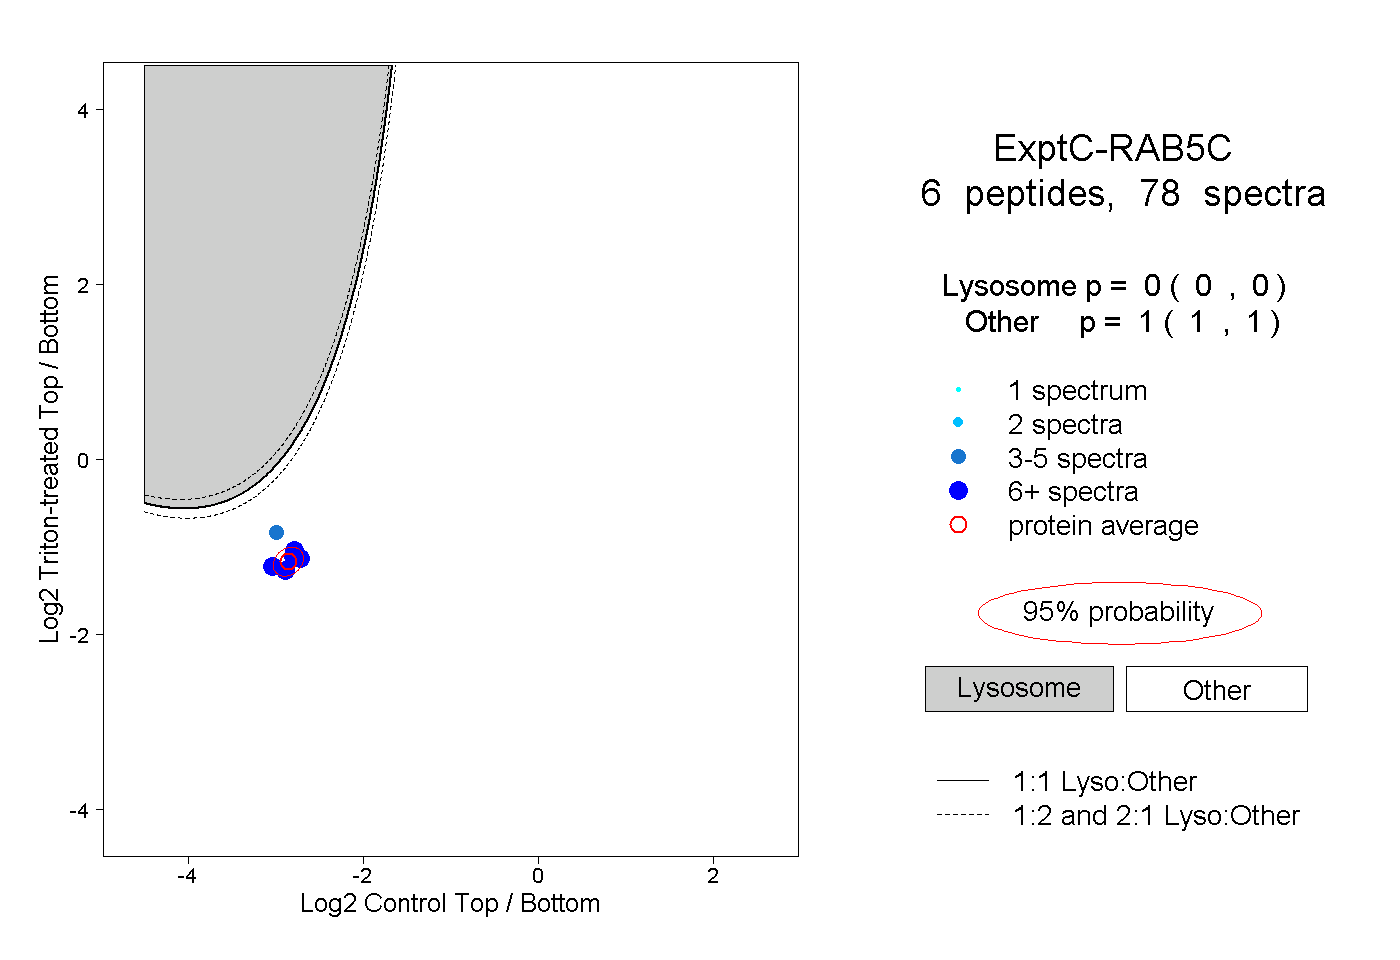
0.000 | 0.000
1.000 | 1.000
2peptides
spectra
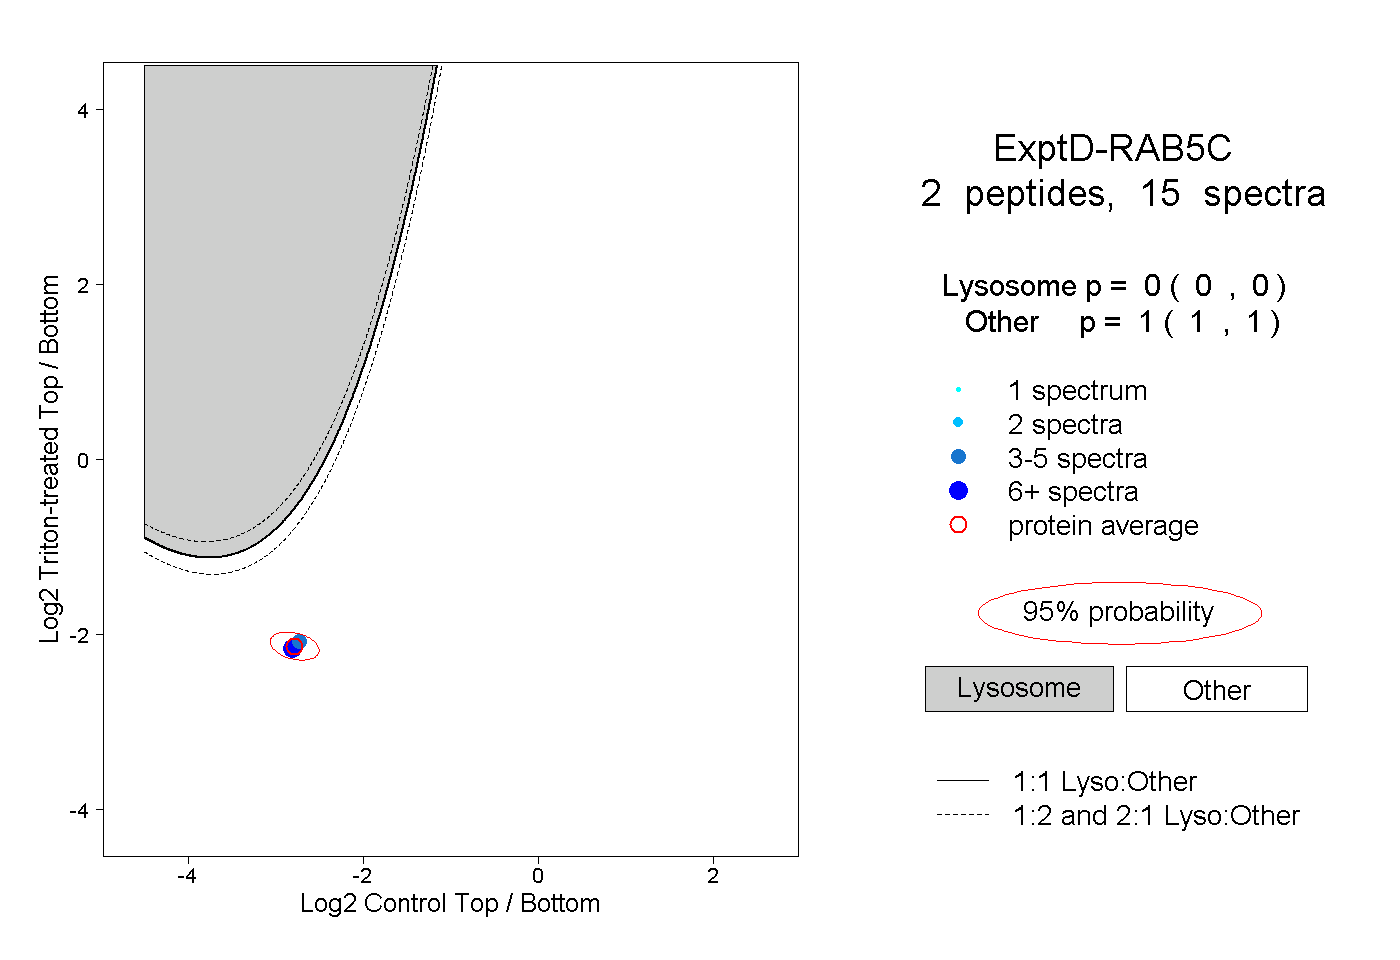
0.000 | 0.000
1.000 | 1.000