 9
9peptides
spectra
0.000 | 0.000
0.230 | 0.250
0.187 | 0.208
0.000 | 0.000
0.123 | 0.149
0.248 | 0.276
0.156 | 0.165
0.000 | 0.000
| Plot | Mito | Lyso | Perox | ER | Golgi | PM | Cytosol | Nucleus | |||||
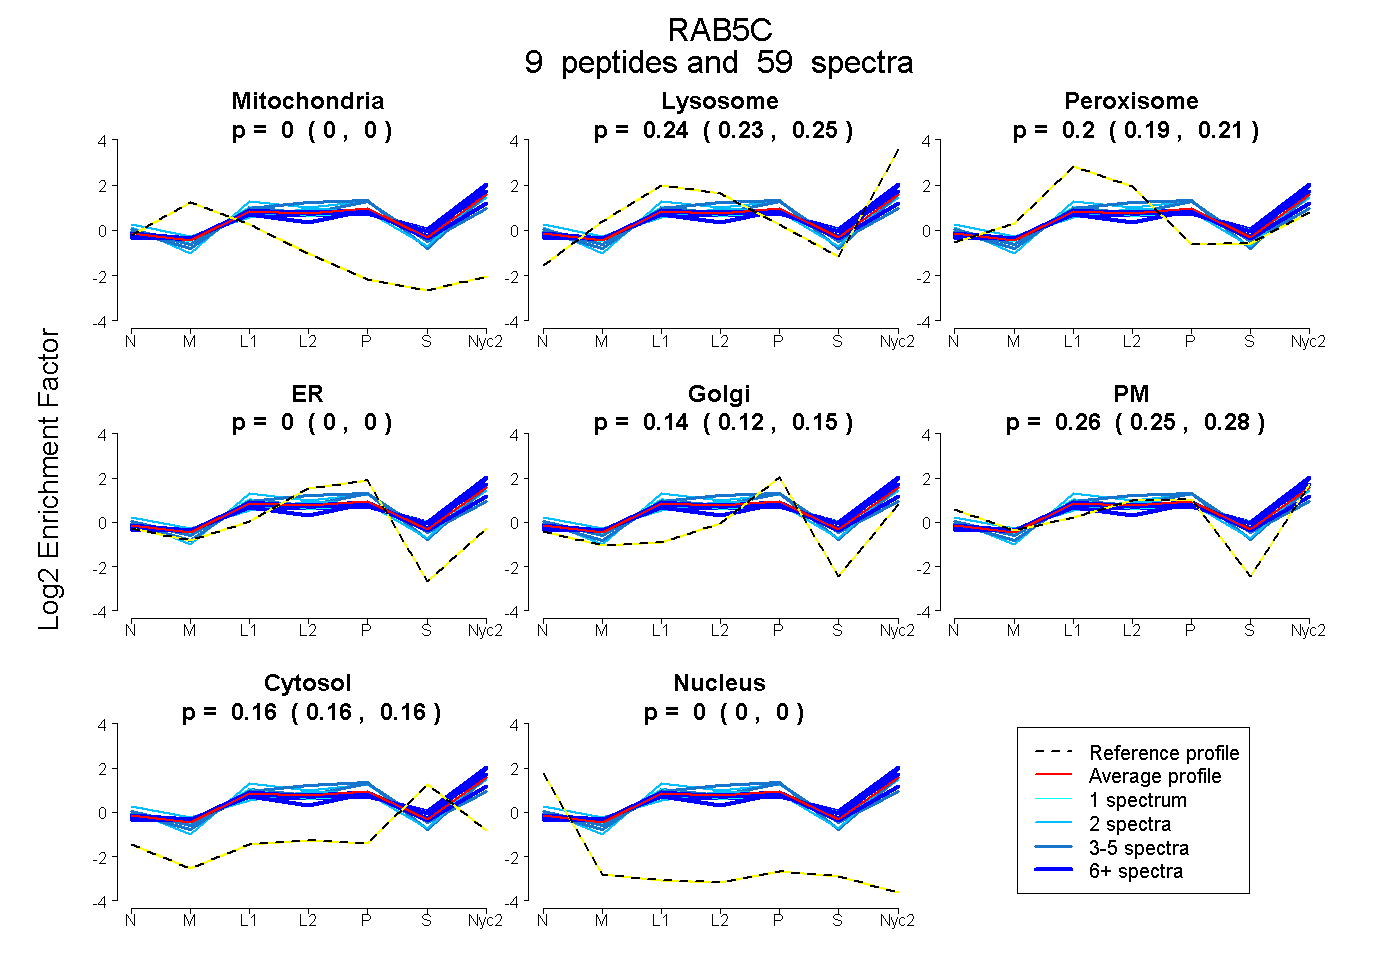
| Expt A |
9 peptides |
59 spectra |
|
0.000 0.000 | 0.000 |
0.241 0.230 | 0.250 |
0.198 0.187 | 0.208 |
0.000 0.000 | 0.000 |
0.136 0.123 | 0.149 |
0.264 0.248 | 0.276 |
0.161 0.156 | 0.165 |
0.000 0.000 | 0.000 |
| 5 spectra, GVDLQESNPASR | 0.000 | 0.026 | 0.439 | 0.000 | 0.450 | 0.007 | 0.077 | 0.000 | ||
| 2 spectra, GGAARPNGPAAGNK | 0.000 | 0.123 | 0.338 | 0.000 | 0.234 | 0.221 | 0.085 | 0.000 | ||
| 9 spectra, TAMNVNEIFMAIAK | 0.000 | 0.393 | 0.081 | 0.000 | 0.067 | 0.274 | 0.185 | 0.000 | ||
| 11 spectra, SSLVLR | 0.000 | 0.320 | 0.161 | 0.000 | 0.025 | 0.278 | 0.216 | 0.000 | ||
| 2 spectra, QASPNIVIALAGNK | 0.000 | 0.187 | 0.119 | 0.000 | 0.000 | 0.559 | 0.134 | 0.000 | ||
| 18 spectra, YHSLAPMYYR | 0.000 | 0.137 | 0.266 | 0.000 | 0.247 | 0.171 | 0.179 | 0.000 | ||
| 1 spectrum, LVLLGESAVGK | 0.000 | 0.330 | 0.180 | 0.000 | 0.050 | 0.222 | 0.218 | 0.000 | ||
| 7 spectra, FEIWDTAGQER | 0.000 | 0.421 | 0.037 | 0.000 | 0.000 | 0.298 | 0.243 | 0.000 | ||
| 4 spectra, NEPQNAAGAPGR | 0.000 | 0.155 | 0.276 | 0.000 | 0.256 | 0.276 | 0.037 | 0.000 |
| Plot | Mito | Lyso or Perox | ER | Golgi | PM | Cytosol | Nucleus | ||||||
| Expt B |
5 peptides |
17 spectra |
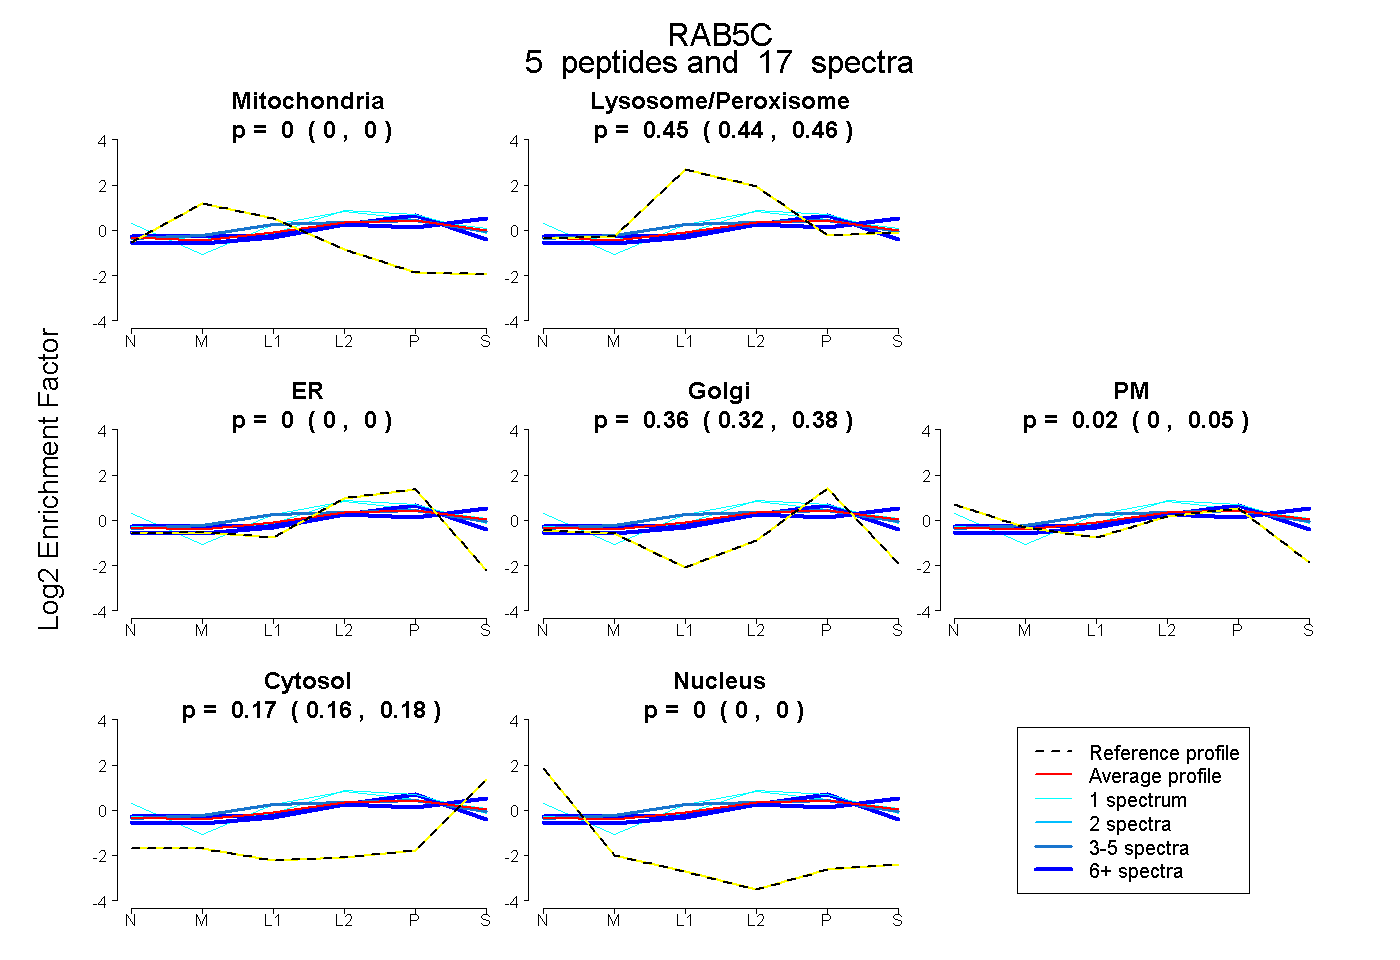 |
0.000 0.000 | 0.000 |
0.453 0.435 | 0.465 |
0.000 0.000 | 0.000 |
0.357 0.321 | 0.379 |
0.018 0.000 | 0.054 |
0.172 0.158 | 0.185 |
0.000 0.000 | 0.000 |
|||
| Plot | Lyso | Other | |||||||||||
| Expt C |
6 peptides |
78 spectra |
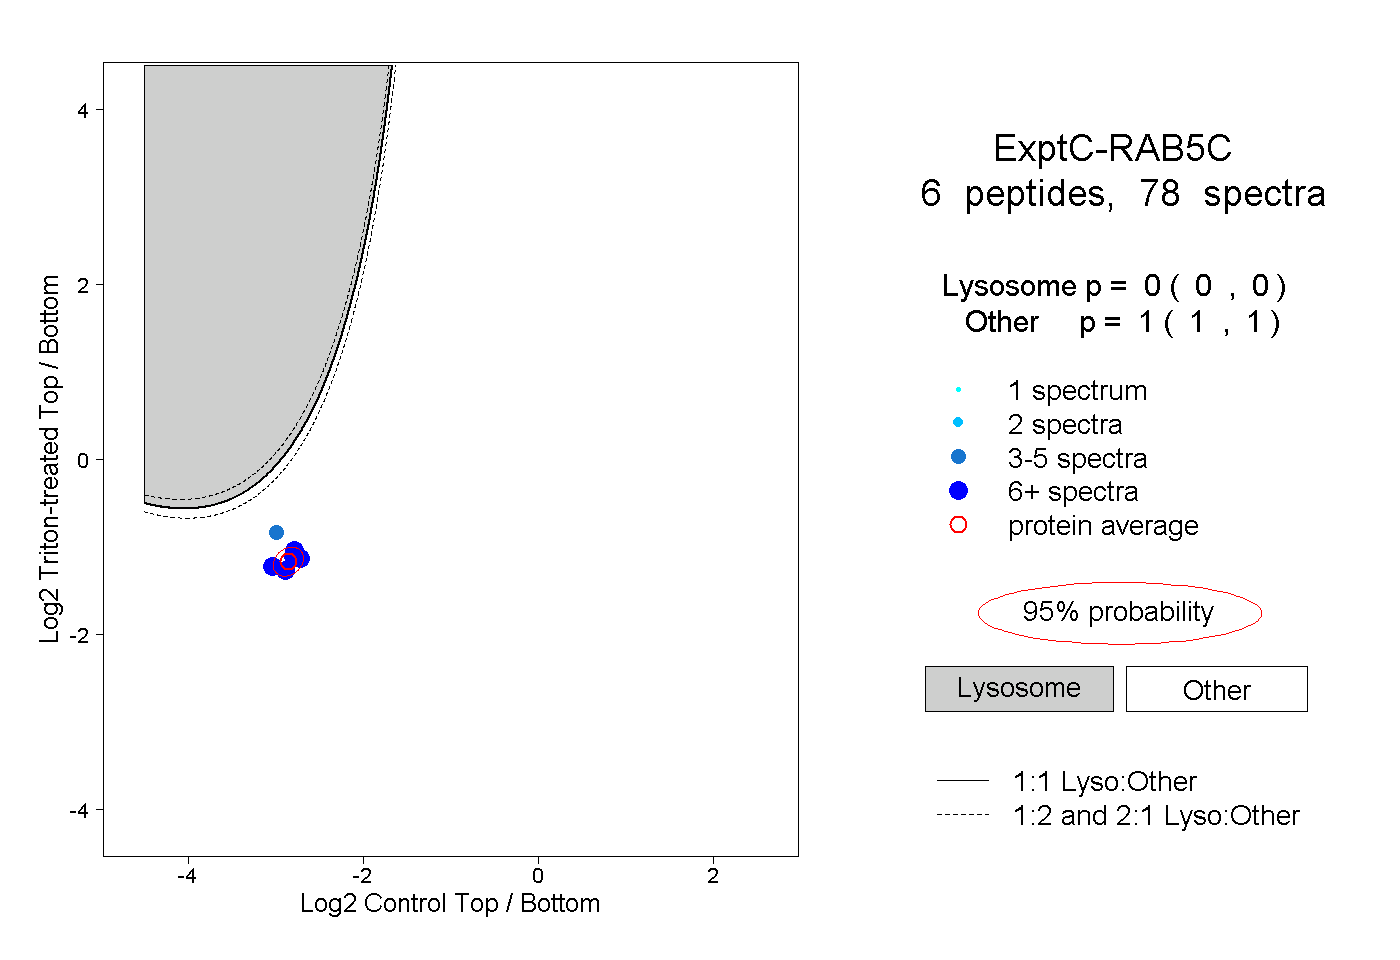 |
0.000 0.000 | 0.000 |
1.000 1.000 | 1.000 |
||||||||
| Plot | Lyso | Other | |||||||||||
| Expt D |
2 peptides |
15 spectra |
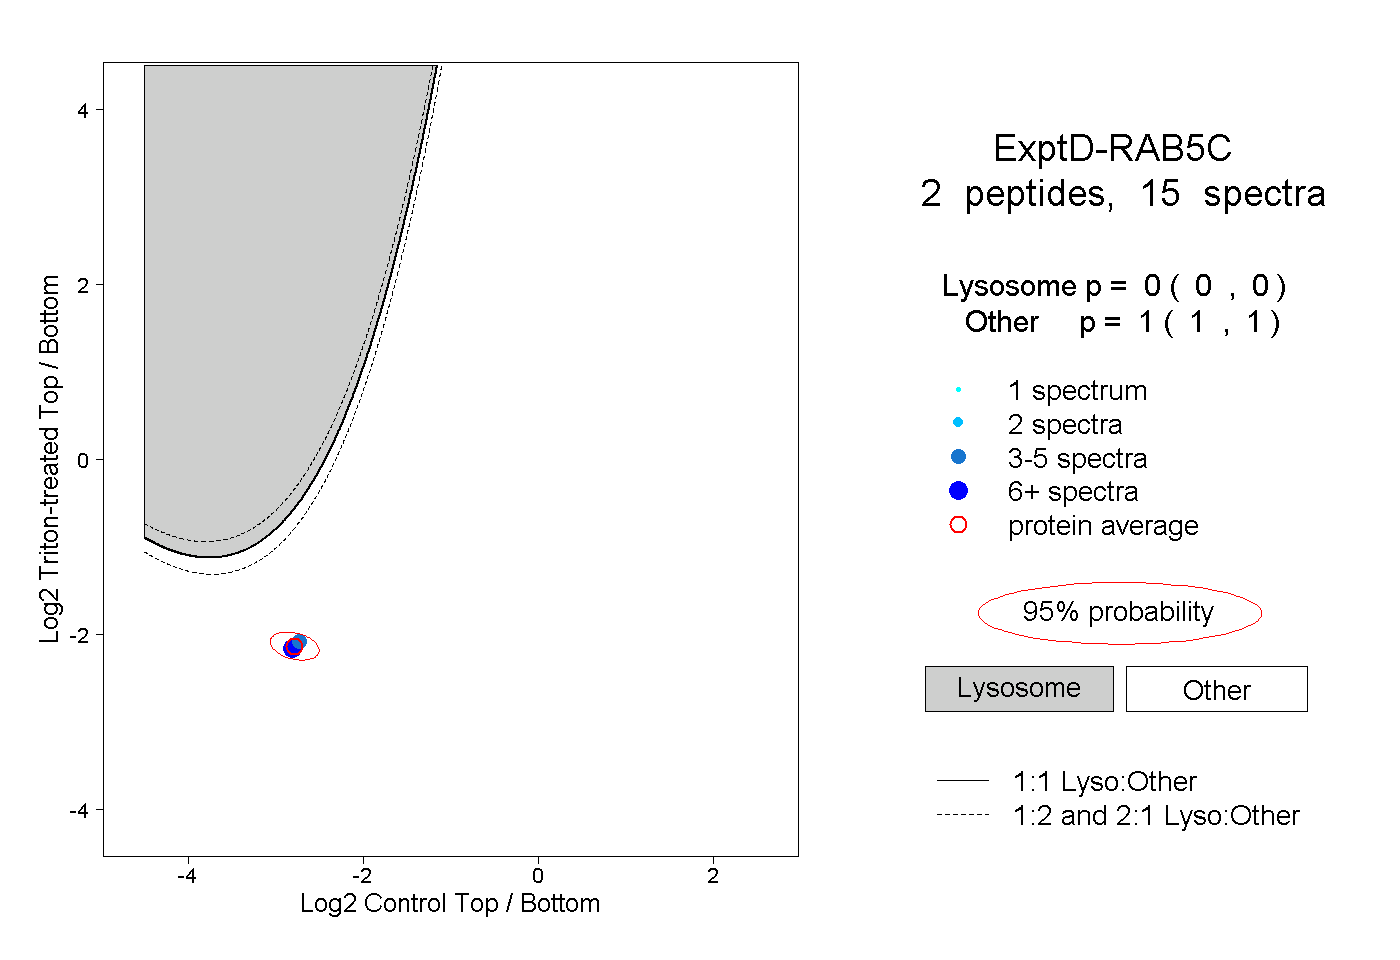 |
0.000 0.000 | 0.000 |
1.000 1.000 | 1.000 |