 8
8peptides
spectra
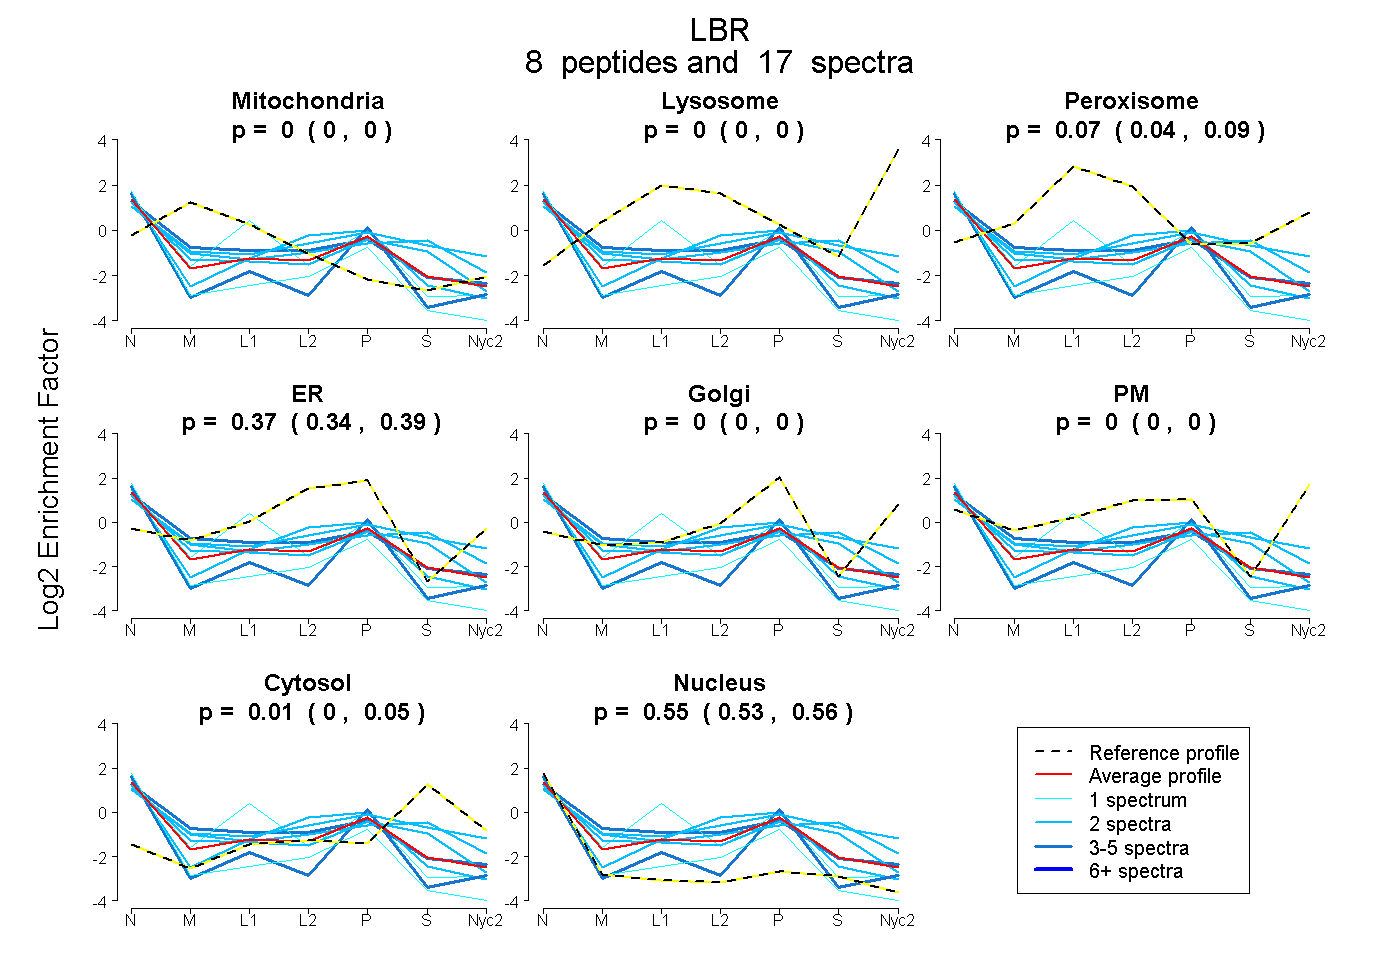
0.000 | 0.000
0.000 | 0.000
0.036 | 0.088
0.340 | 0.394
0.000 | 0.000
0.000 | 0.000
0.000 | 0.045
0.531 | 0.562
1peptide
spectrum
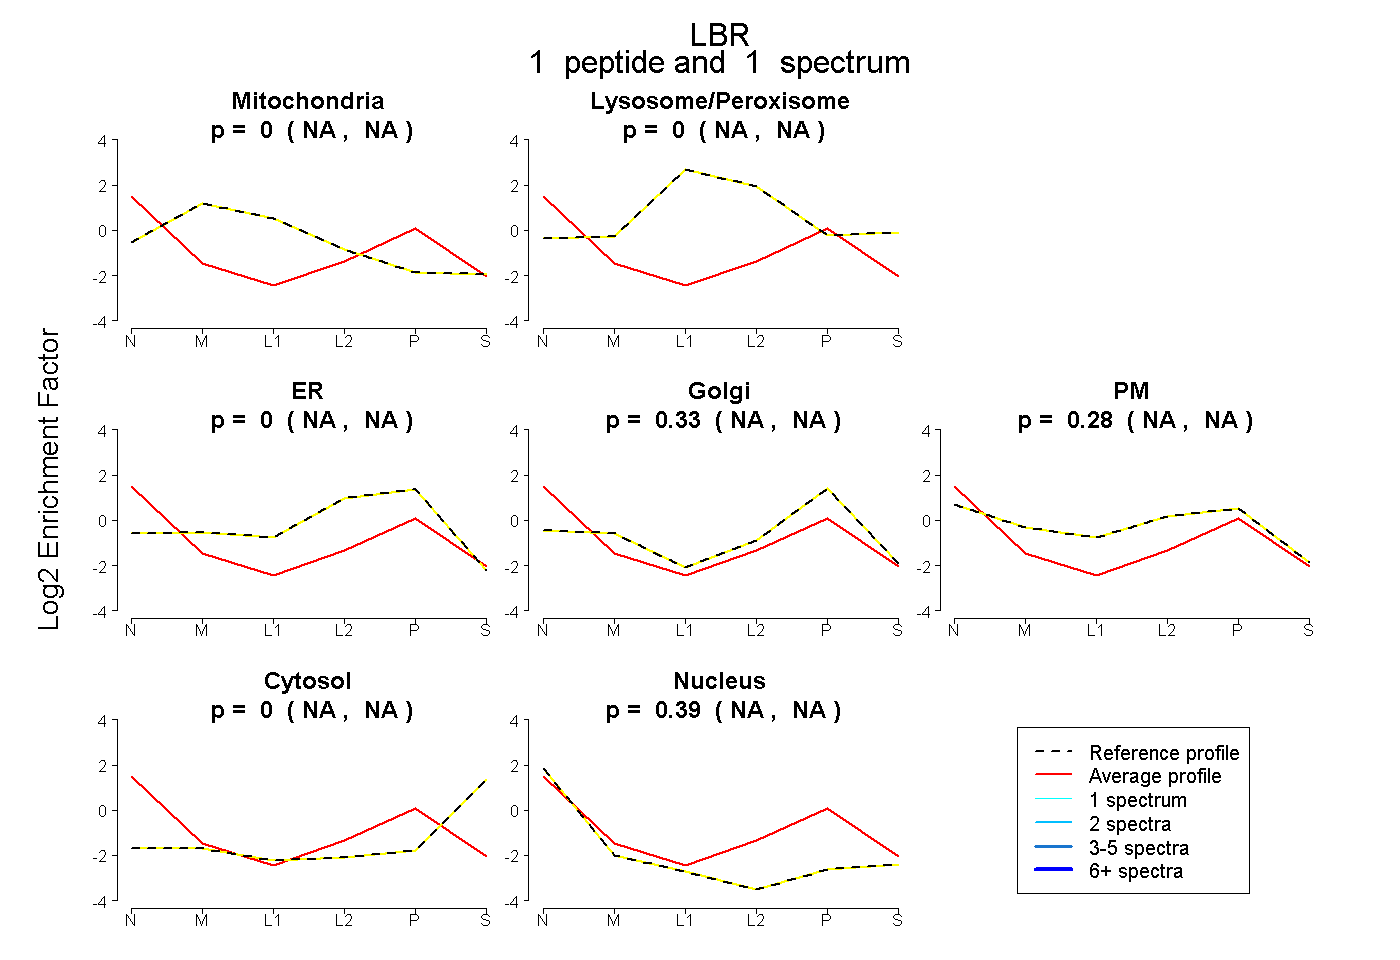
NA | NA
NA | NA
NA | NA
NA | NA
NA | NA
NA | NA
NA | NA
3peptides
spectra
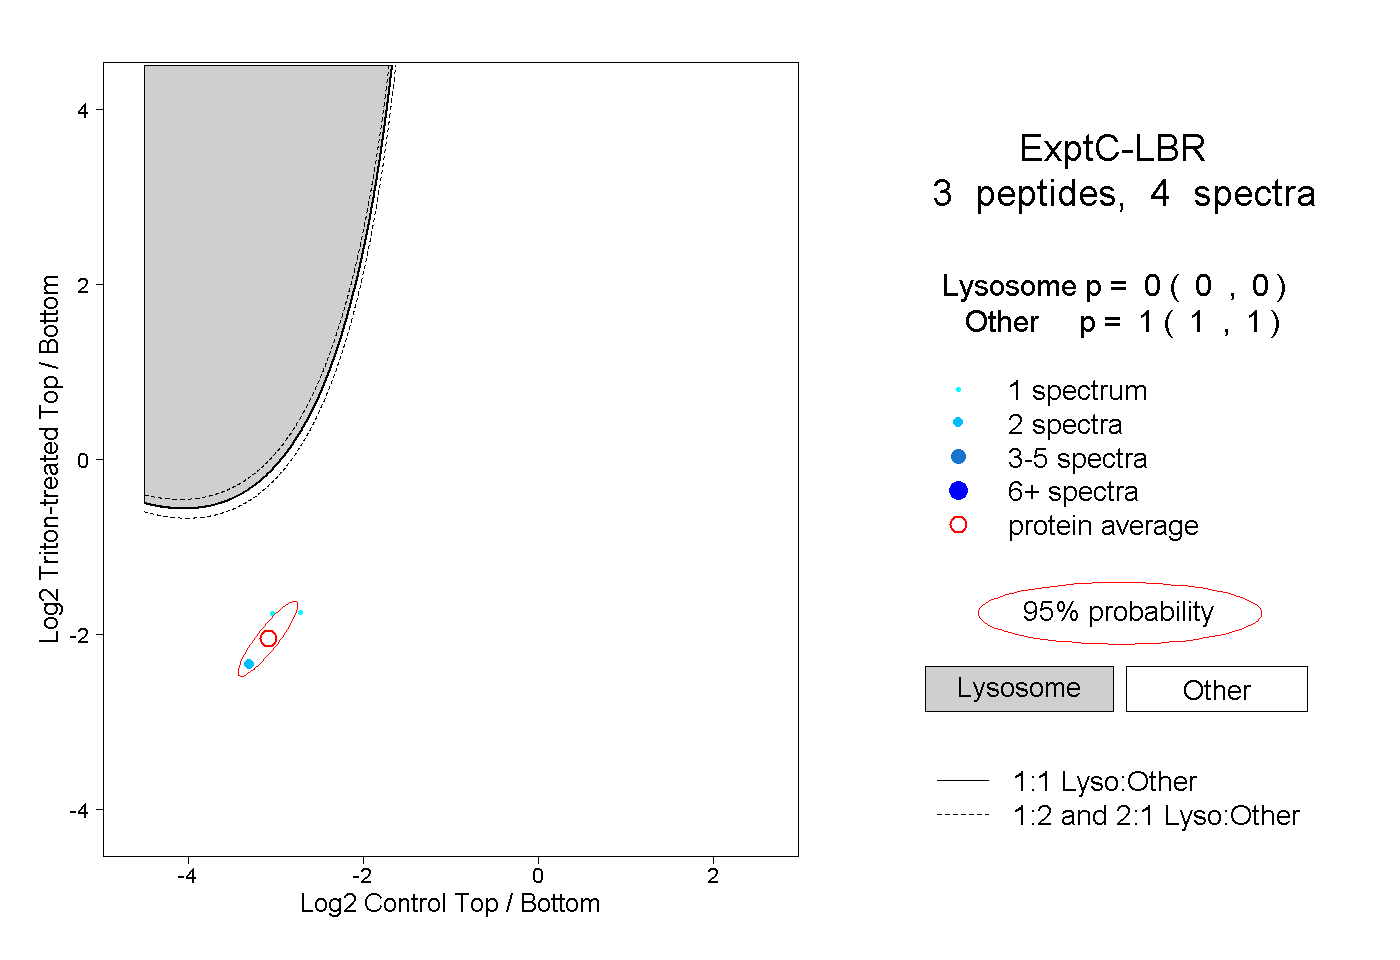
0.000 | 0.000
1.000 | 1.000