 8
8peptides
spectra
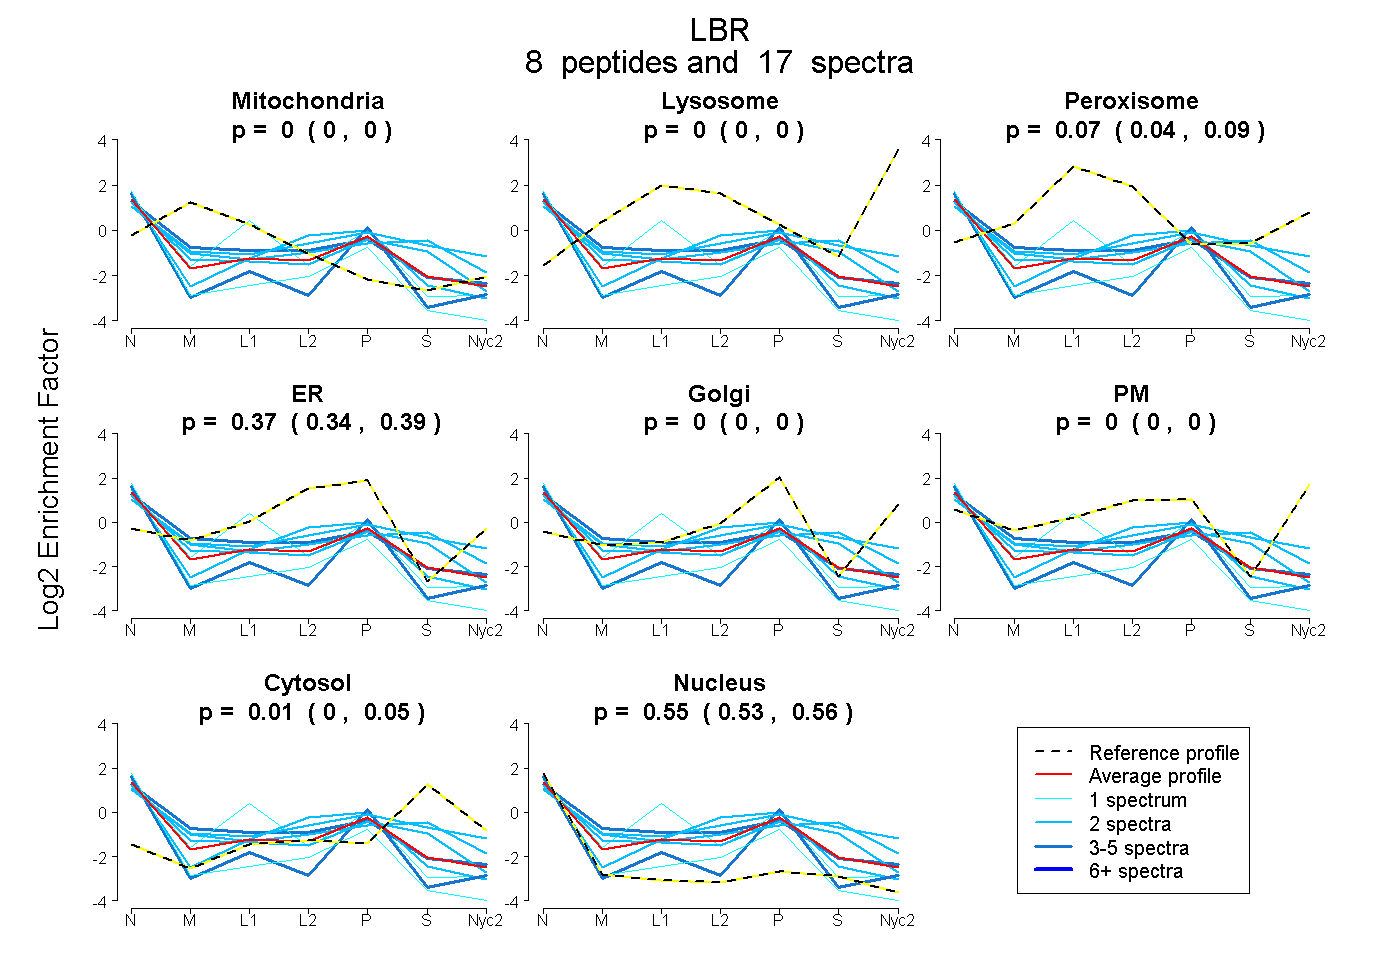
0.000 | 0.000
0.000 | 0.000
0.036 | 0.088
0.340 | 0.394
0.000 | 0.000
0.000 | 0.000
0.000 | 0.045
0.531 | 0.562
| Plot | Mito | Lyso | Perox | ER | Golgi | PM | Cytosol | Nucleus | |||||
| Expt A |
8 peptides |
17 spectra |
|
0.000 0.000 | 0.000 |
0.000 0.000 | 0.000 |
0.068 0.036 | 0.088 |
0.368 0.340 | 0.394 |
0.000 0.000 | 0.000 |
0.000 0.000 | 0.000 |
0.012 0.000 | 0.045 |
0.551 0.531 | 0.562 |
| 2 spectra, TIPTSTGK | 0.056 | 0.000 | 0.115 | 0.148 | 0.000 | 0.058 | 0.286 | 0.337 | ||
| 1 spectrum, ESDIKPLK | 0.136 | 0.000 | 0.057 | 0.361 | 0.000 | 0.000 | 0.000 | 0.446 | ||
| 2 spectra, IGAFDLK | 0.000 | 0.000 | 0.000 | 0.482 | 0.000 | 0.000 | 0.000 | 0.518 | ||
| 1 spectrum, SGSTSSSPSR | 0.000 | 0.000 | 0.000 | 0.198 | 0.000 | 0.000 | 0.000 | 0.802 | ||
| 2 spectra, SQVYTVK | 0.080 | 0.000 | 0.031 | 0.246 | 0.000 | 0.000 | 0.208 | 0.435 | ||
| 4 spectra, ELWEAR | 0.192 | 0.000 | 0.061 | 0.344 | 0.000 | 0.000 | 0.000 | 0.403 | ||
| 3 spectra, SATPPK | 0.000 | 0.000 | 0.000 | 0.000 | 0.310 | 0.000 | 0.000 | 0.690 | ||
| 2 spectra, YGLAWEK | 0.005 | 0.000 | 0.089 | 0.144 | 0.000 | 0.236 | 0.252 | 0.274 |
| Plot | Mito | Lyso or Perox | ER | Golgi | PM | Cytosol | Nucleus | ||||||
| Expt B |
1 peptide |
1 spectrum |
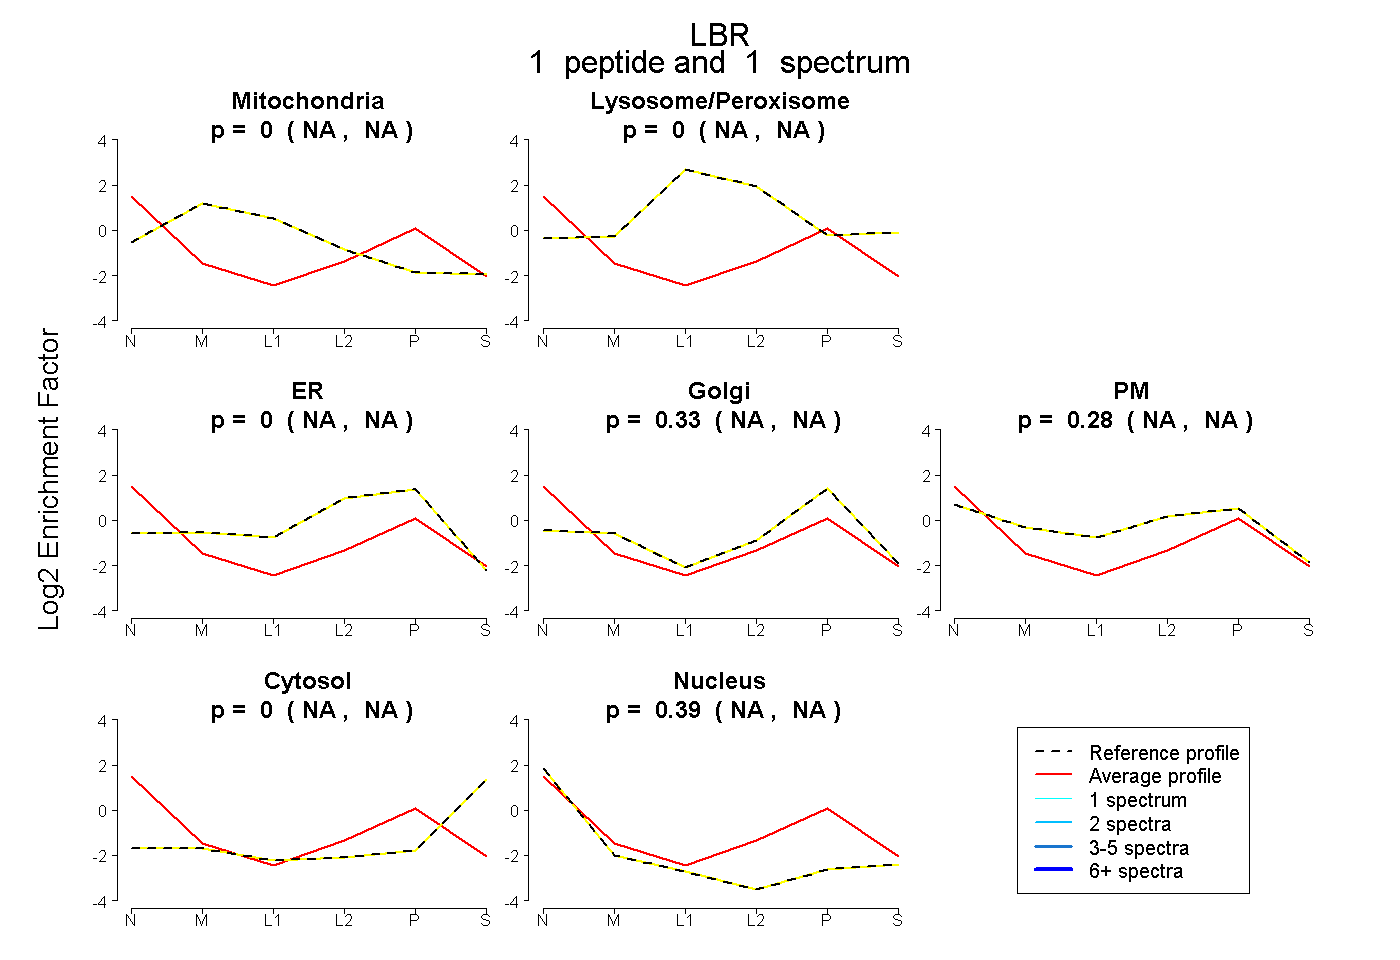 |
0.000 NA | NA |
0.000 NA | NA |
0.000 NA | NA |
0.333 NA | NA |
0.277 NA | NA |
0.000 NA | NA |
0.390 NA | NA |
|||
| Plot | Lyso | Other | |||||||||||
| Expt C |
3 peptides |
4 spectra |
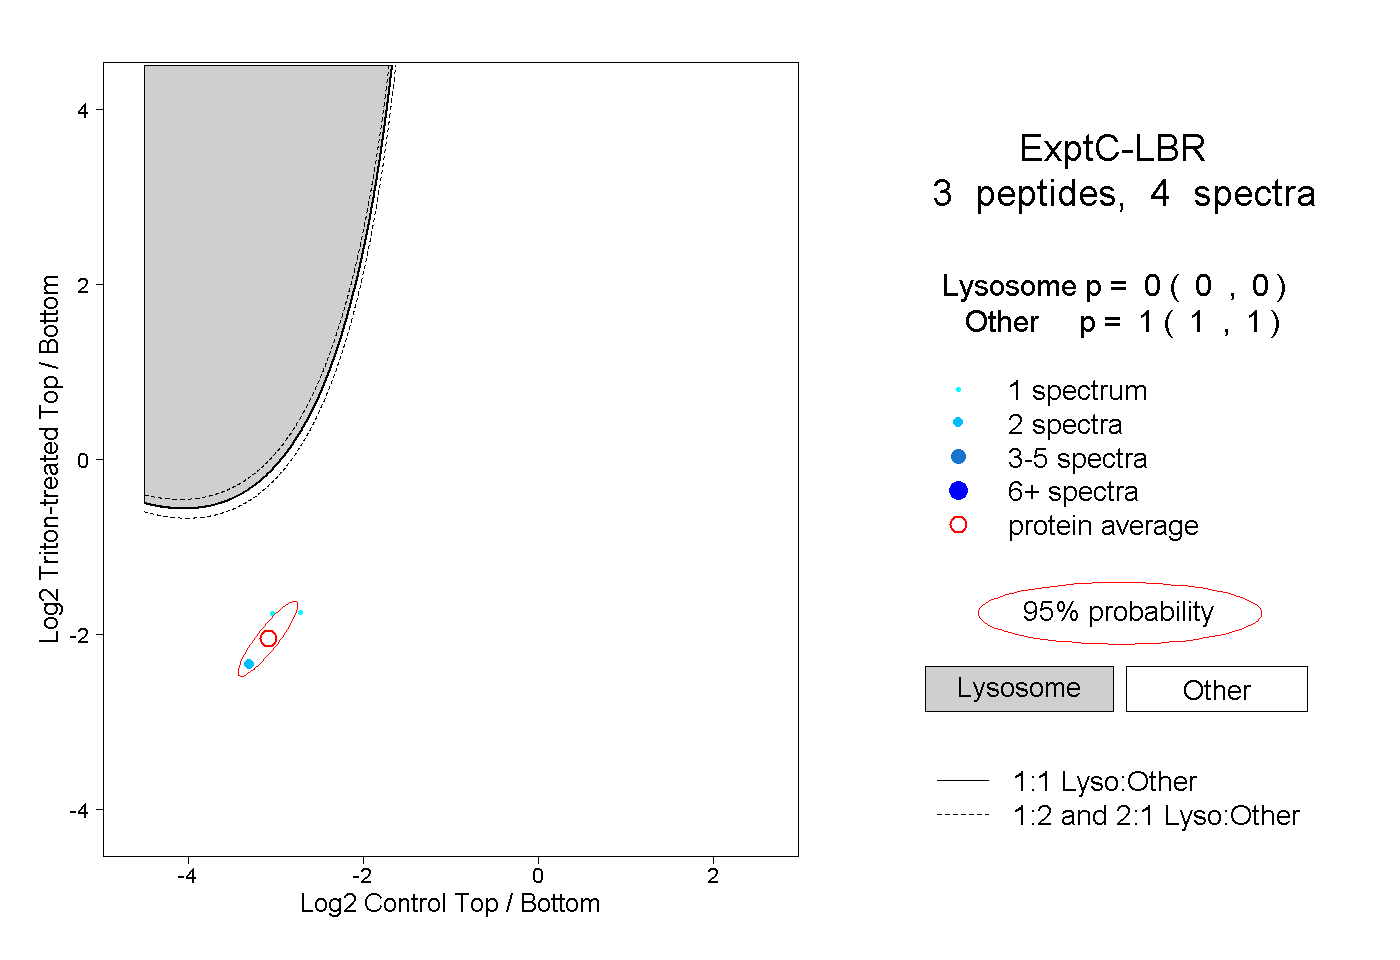 |
0.000 0.000 | 0.000 |
1.000 1.000 | 1.000 |