 6
6peptides
spectra
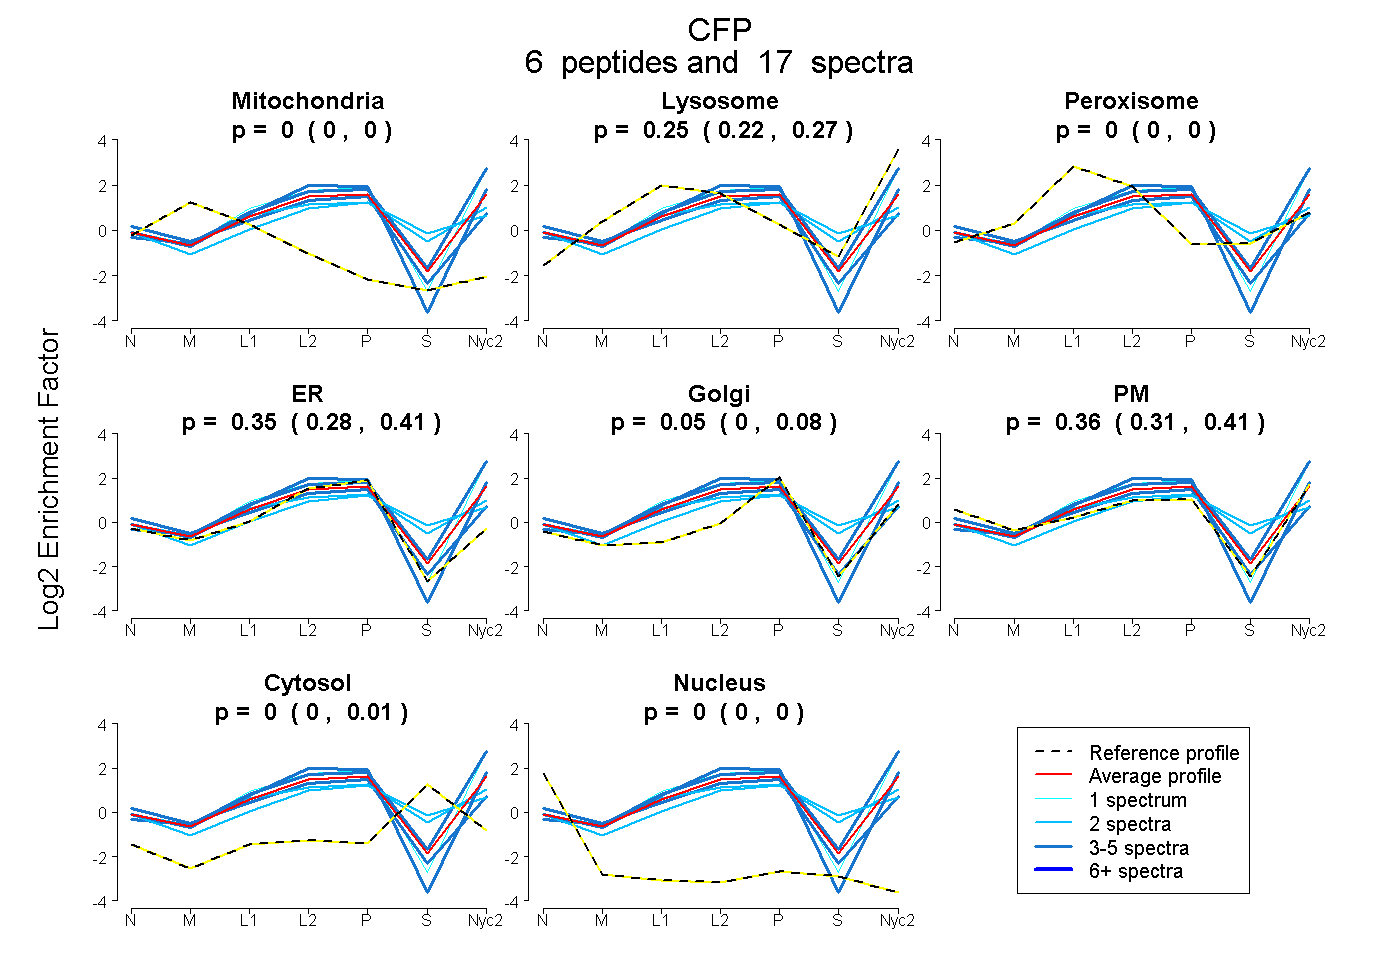
0.000 | 0.000
0.219 | 0.275
0.000 | 0.000
0.276 | 0.405
0.000 | 0.082
0.308 | 0.406
0.000 | 0.014
0.000 | 0.000
1peptide
spectrum
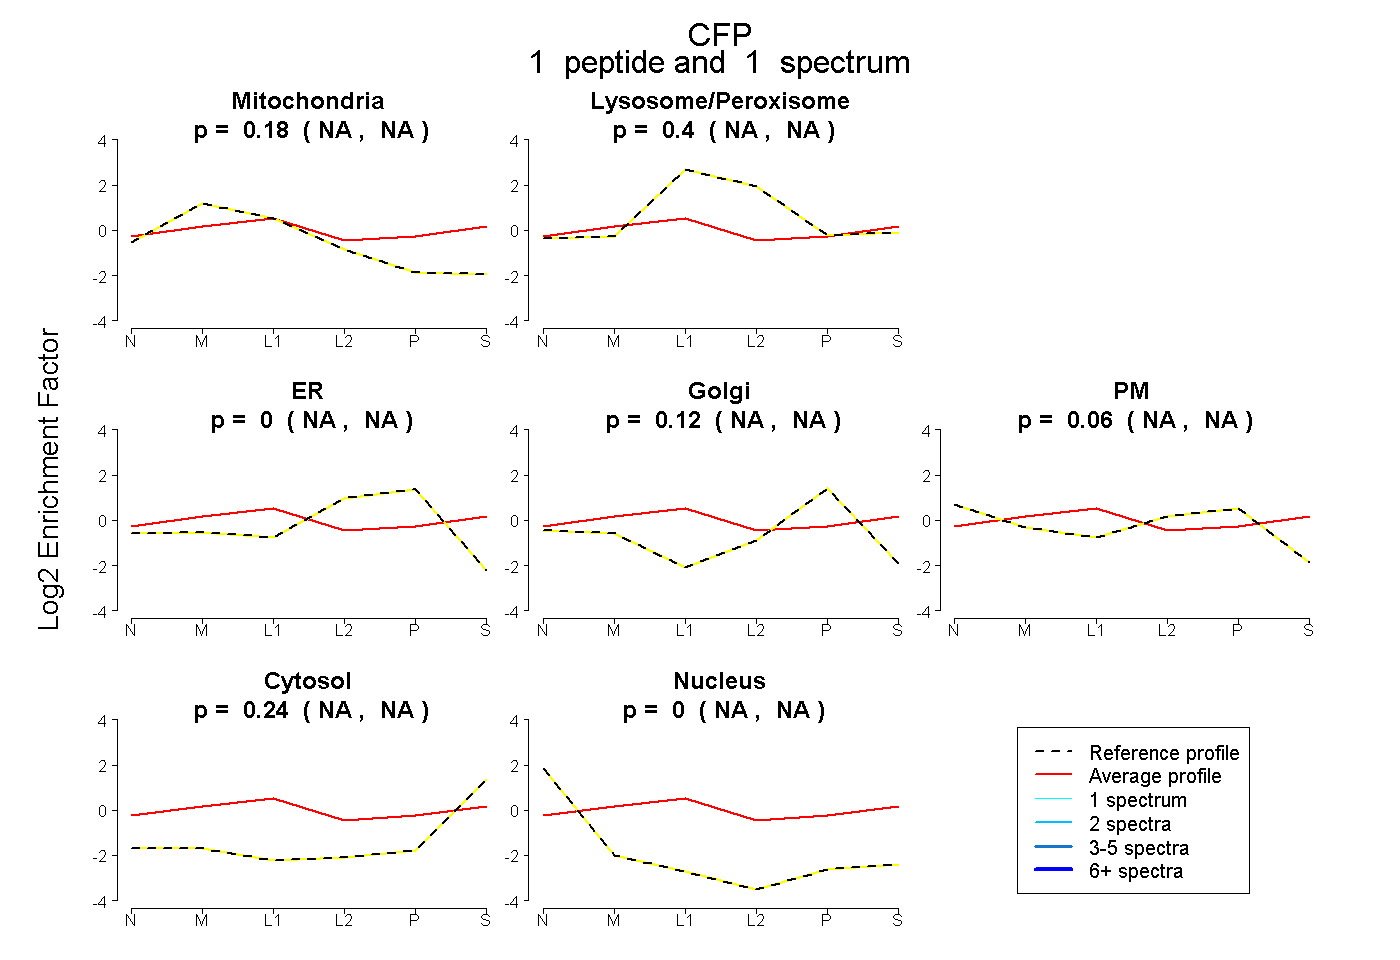
NA | NA
NA | NA
NA | NA
NA | NA
NA | NA
NA | NA
NA | NA
7peptides
spectra
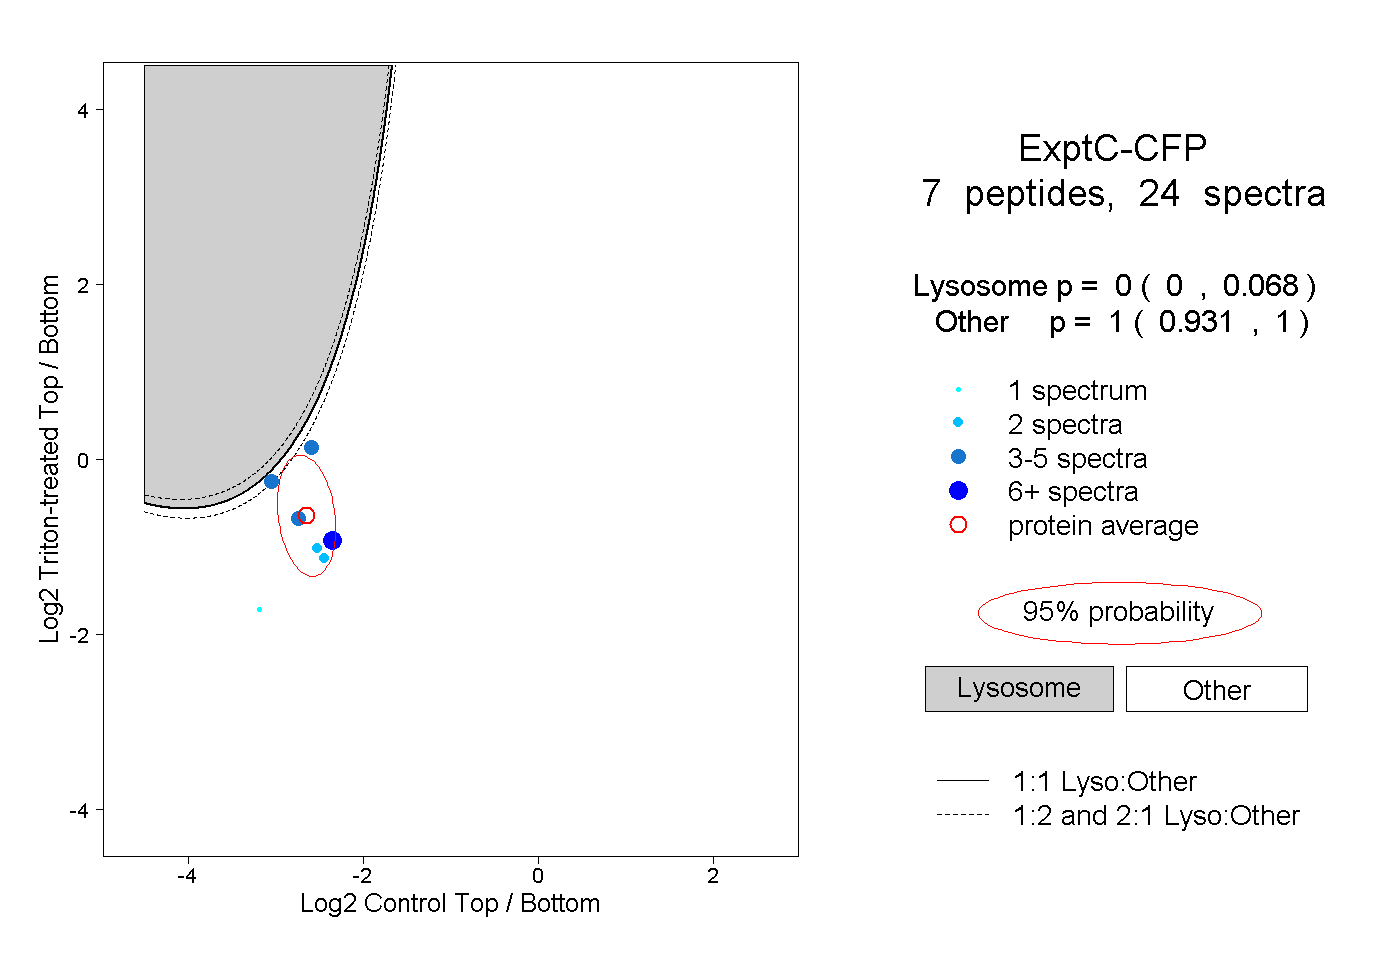
0.000 | 0.068
0.931 | 1.000
4peptides
spectra
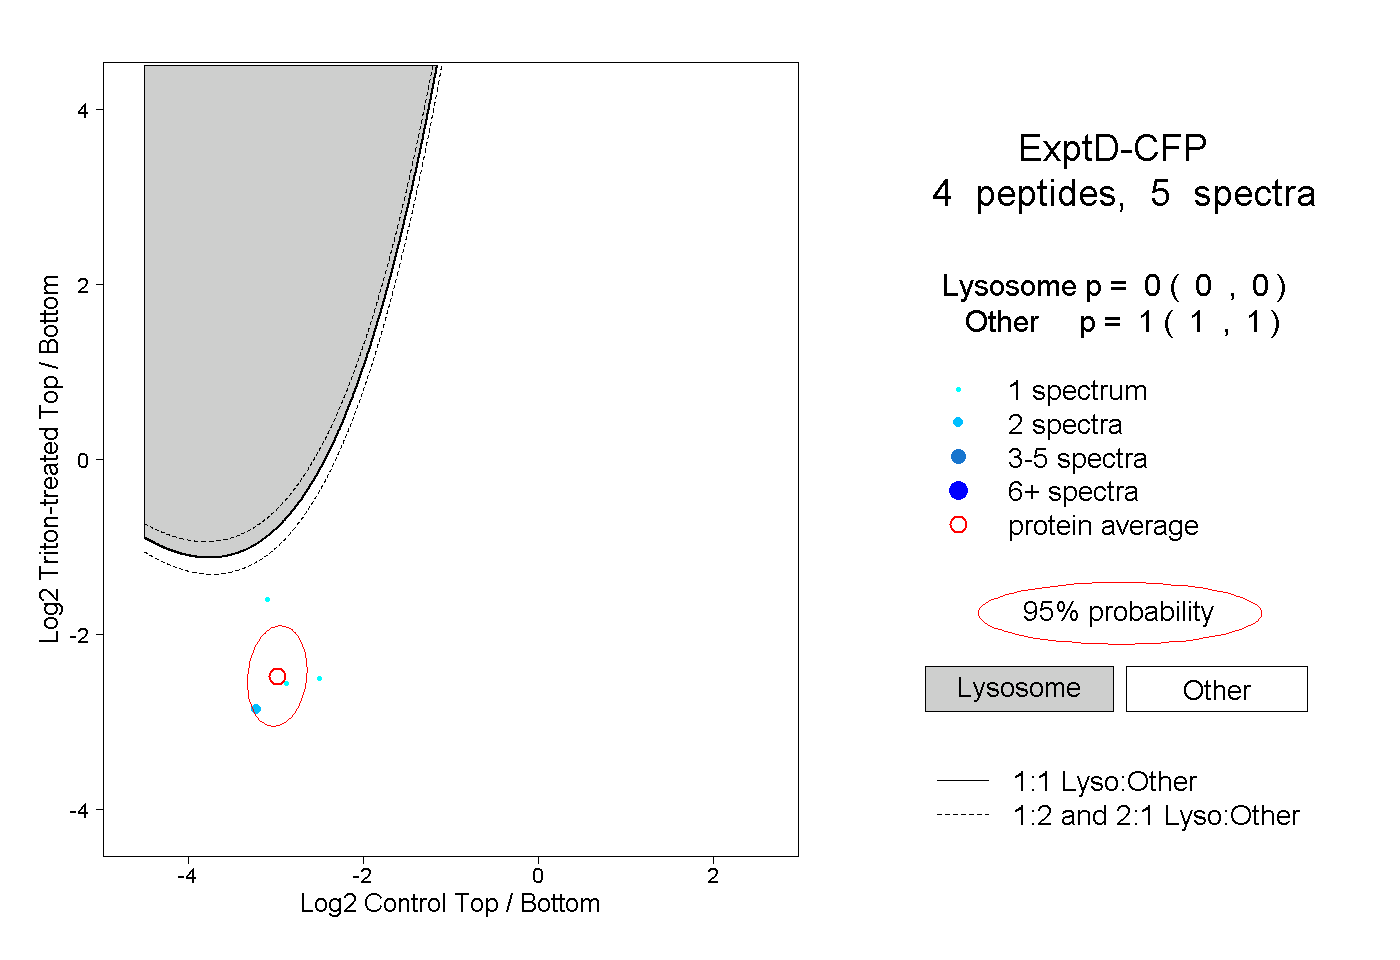
0.000 | 0.000
1.000 | 1.000