 6
6peptides
spectra
0.000 | 0.000
0.219 | 0.275
0.000 | 0.000
0.276 | 0.405
0.000 | 0.082
0.308 | 0.406
0.000 | 0.014
0.000 | 0.000
| Plot | Mito | Lyso | Perox | ER | Golgi | PM | Cytosol | Nucleus | |||||
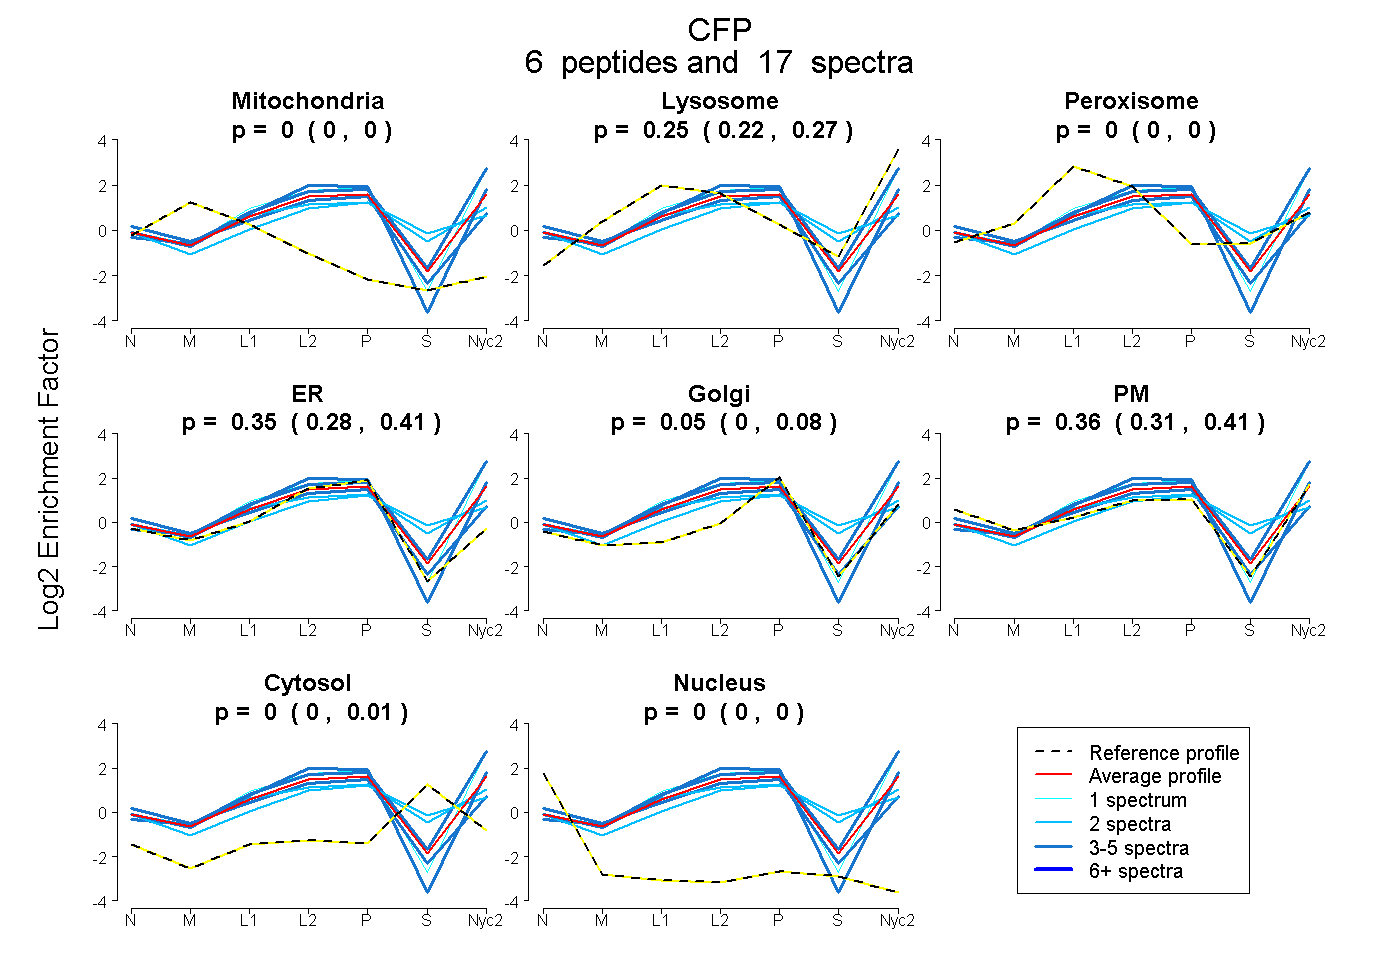
| Expt A |
6 peptides |
17 spectra |
|
0.000 0.000 | 0.000 |
0.250 0.219 | 0.275 |
0.000 0.000 | 0.000 |
0.346 0.276 | 0.405 |
0.046 0.000 | 0.082 |
0.358 0.308 | 0.406 |
0.000 0.000 | 0.014 |
0.000 0.000 | 0.000 |
| 2 spectra, RPCLHVPSCR | 0.000 | 0.111 | 0.086 | 0.301 | 0.023 | 0.200 | 0.278 | 0.000 | ||
| 2 spectra, HGGPFCAGDATR | 0.000 | 0.089 | 0.309 | 0.095 | 0.262 | 0.135 | 0.110 | 0.000 | ||
| 4 spectra, LCDNPAPK | 0.000 | 0.440 | 0.000 | 0.086 | 0.119 | 0.355 | 0.000 | 0.000 | ||
| 4 spectra, HCYDIHNCVLK | 0.000 | 0.000 | 0.078 | 0.460 | 0.000 | 0.463 | 0.000 | 0.000 | ||
| 4 spectra, SISCDEIPGQQSR | 0.000 | 0.138 | 0.000 | 0.413 | 0.000 | 0.449 | 0.000 | 0.000 | ||
| 1 spectrum, GGQCSEK | 0.000 | 0.305 | 0.000 | 0.109 | 0.000 | 0.586 | 0.000 | 0.000 |
| Plot | Mito | Lyso or Perox | ER | Golgi | PM | Cytosol | Nucleus | ||||||
| Expt B |
1 peptide |
1 spectrum |
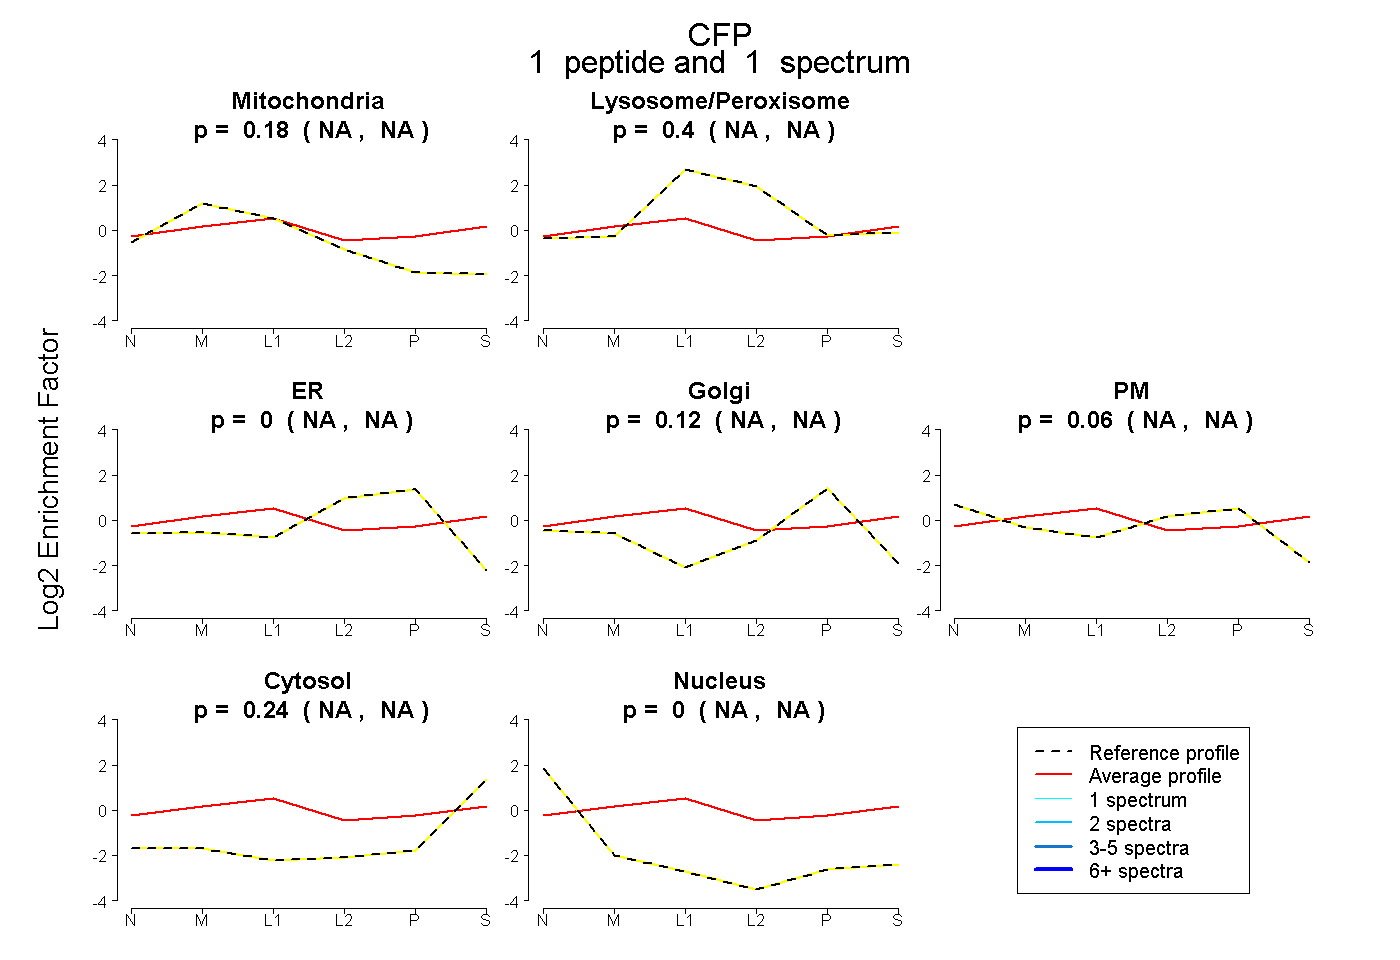 |
0.182 NA | NA |
0.400 NA | NA |
0.000 NA | NA |
0.115 NA | NA |
0.061 NA | NA |
0.241 NA | NA |
0.000 NA | NA |
|||
| Plot | Lyso | Other | |||||||||||
| Expt C |
7 peptides |
24 spectra |
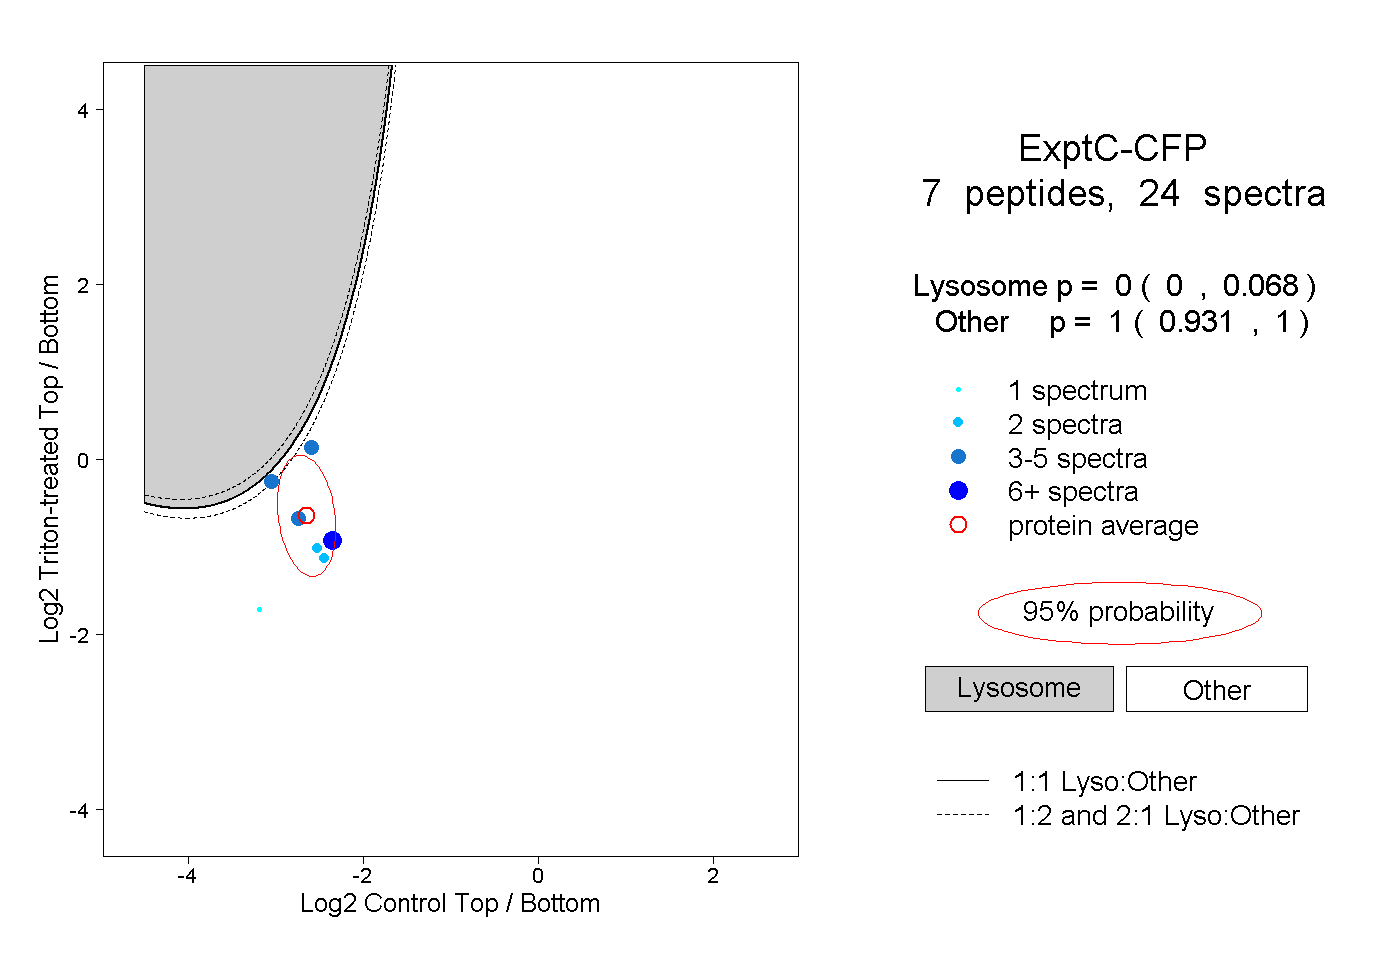 |
0.000 0.000 | 0.068 |
1.000 0.931 | 1.000 |
||||||||
| Plot | Lyso | Other | |||||||||||
| Expt D |
4 peptides |
5 spectra |
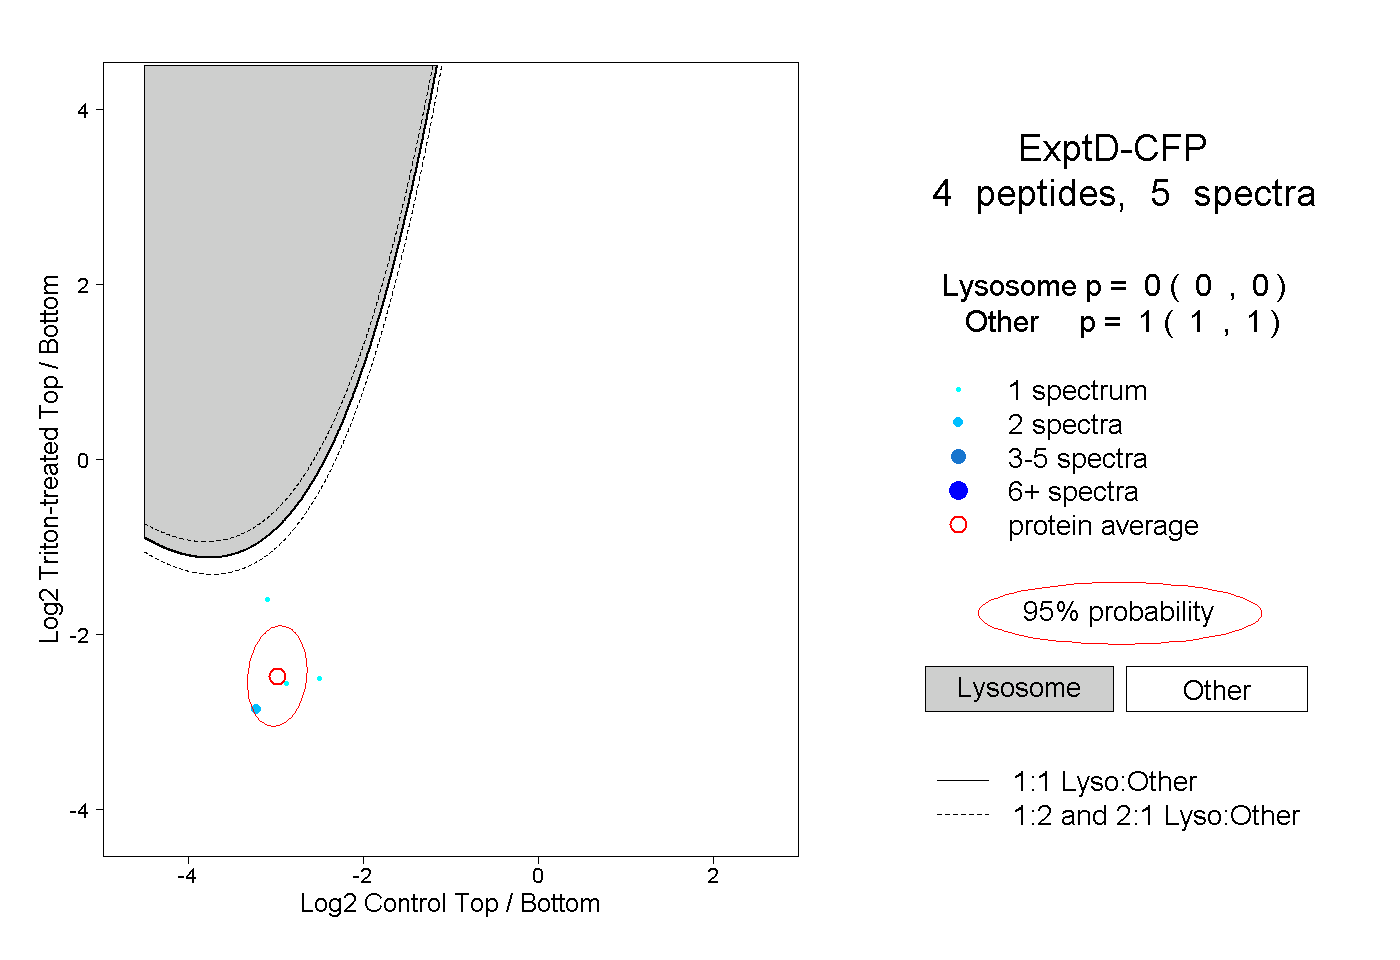 |
0.000 0.000 | 0.000 |
1.000 1.000 | 1.000 |