 7
7peptides
spectra
0.000 | 0.000
0.000 | 0.000
0.000 | 0.000
0.140 | 0.224
0.147 | 0.207
0.344 | 0.415
0.239 | 0.265
0.000 | 0.000
9peptides
spectra
0.000 | 0.000
1.000 | 1.000
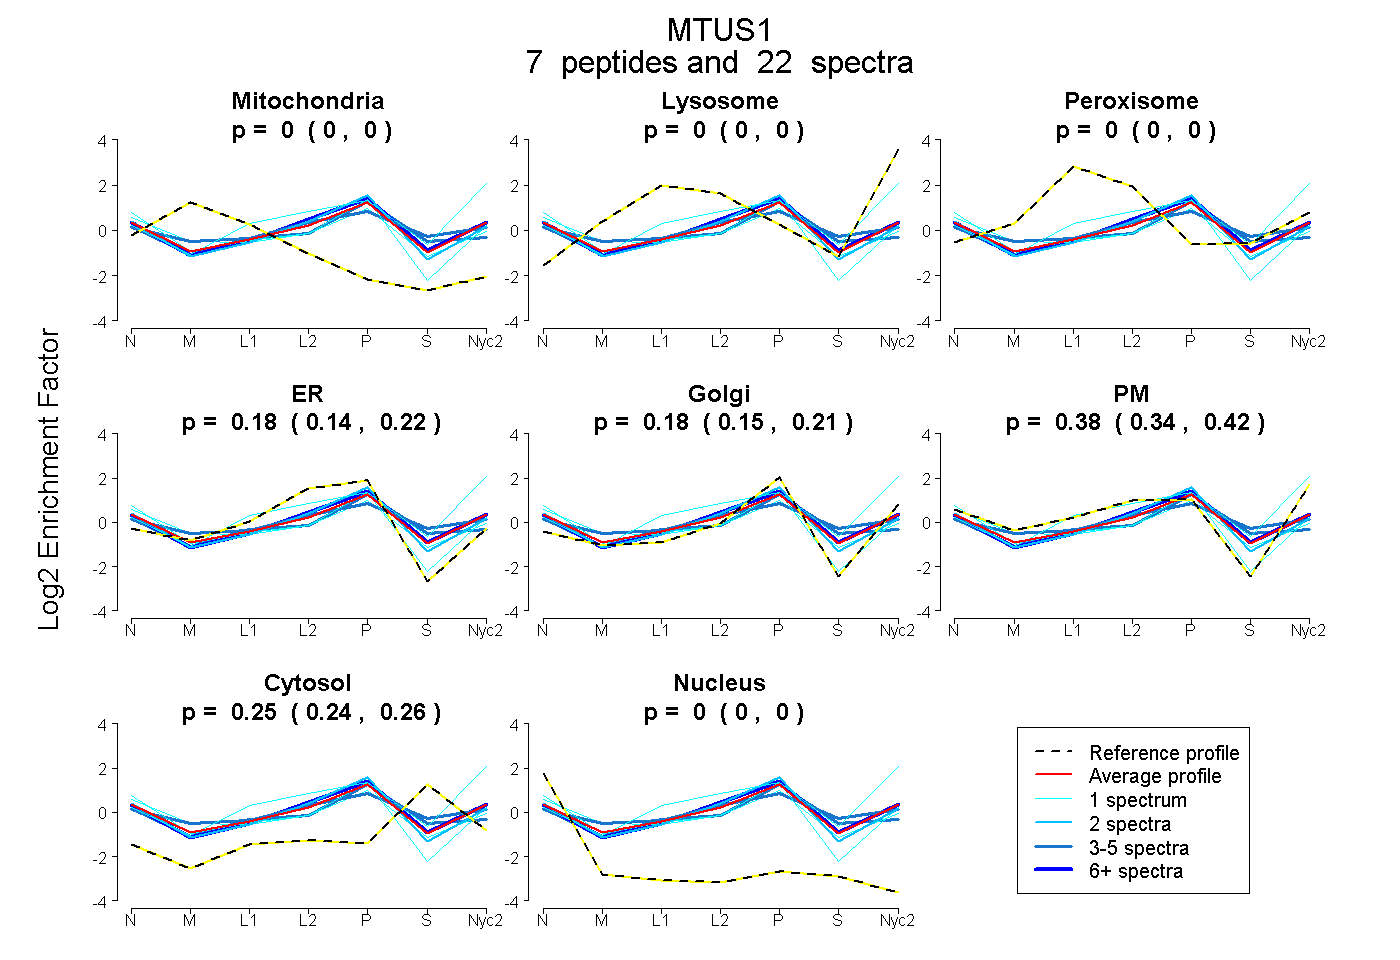
| Plot | Mito | Lyso | Perox | ER | Golgi | PM | Cytosol | Nucleus | |||||
| Expt A |
7 peptides |
22 spectra |
|
0.000 0.000 | 0.000 |
0.000 0.000 | 0.000 |
0.000 0.000 | 0.000 |
0.185 0.140 | 0.224 |
0.180 0.147 | 0.207 |
0.382 0.344 | 0.415 |
0.253 0.239 | 0.265 |
0.000 0.000 | 0.000 |
||
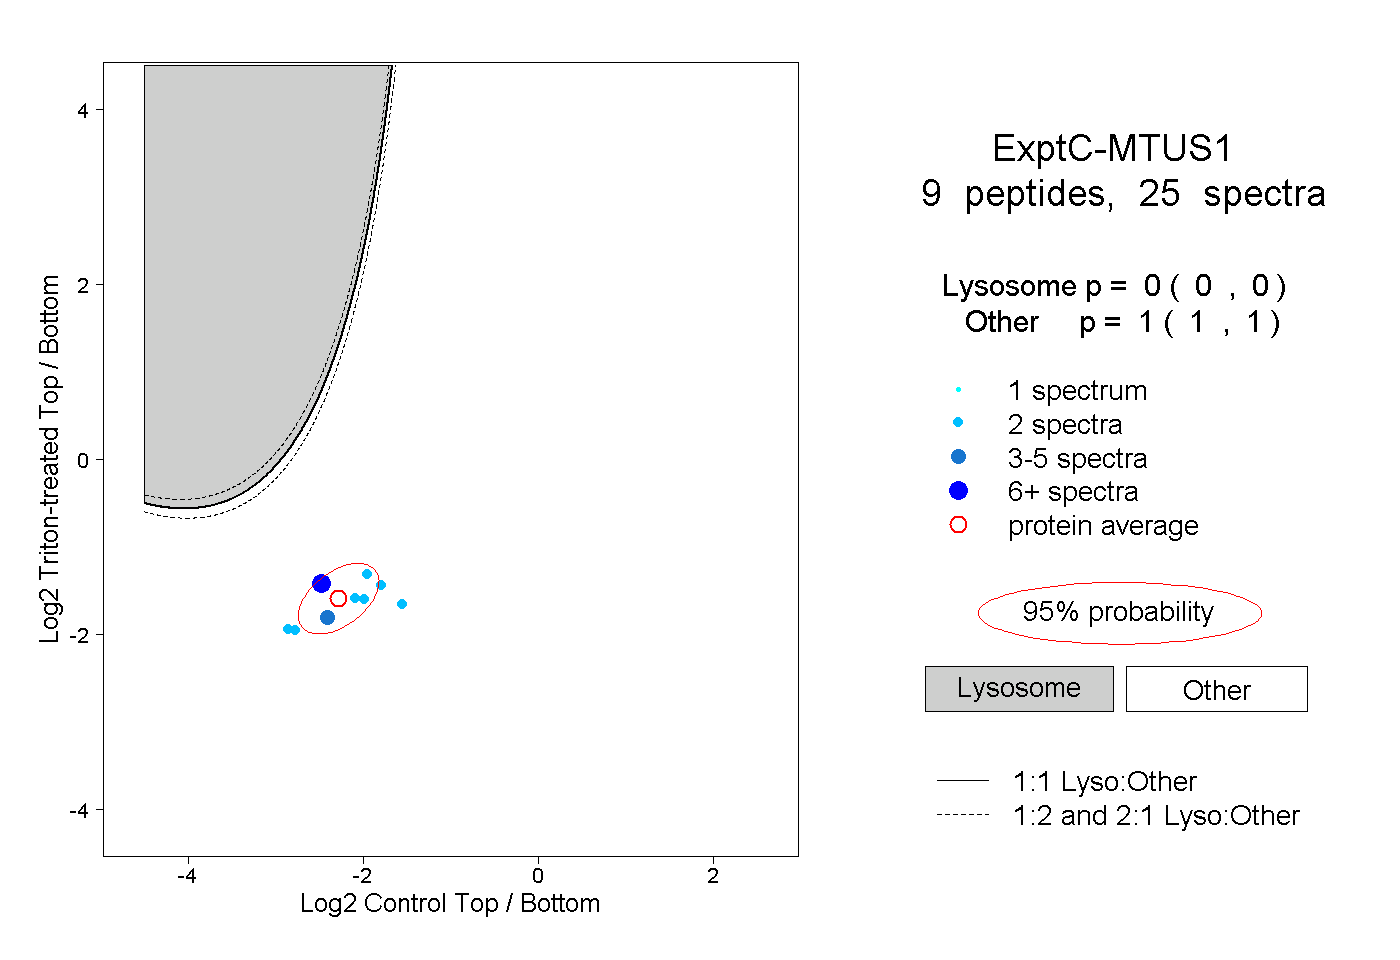
| Plot | Lyso | Other | |||||||||||
| Expt C |
9 peptides |
25 spectra |
|
0.000 0.000 | 0.000 |
1.000 1.000 | 1.000 |