 7
7peptides
spectra
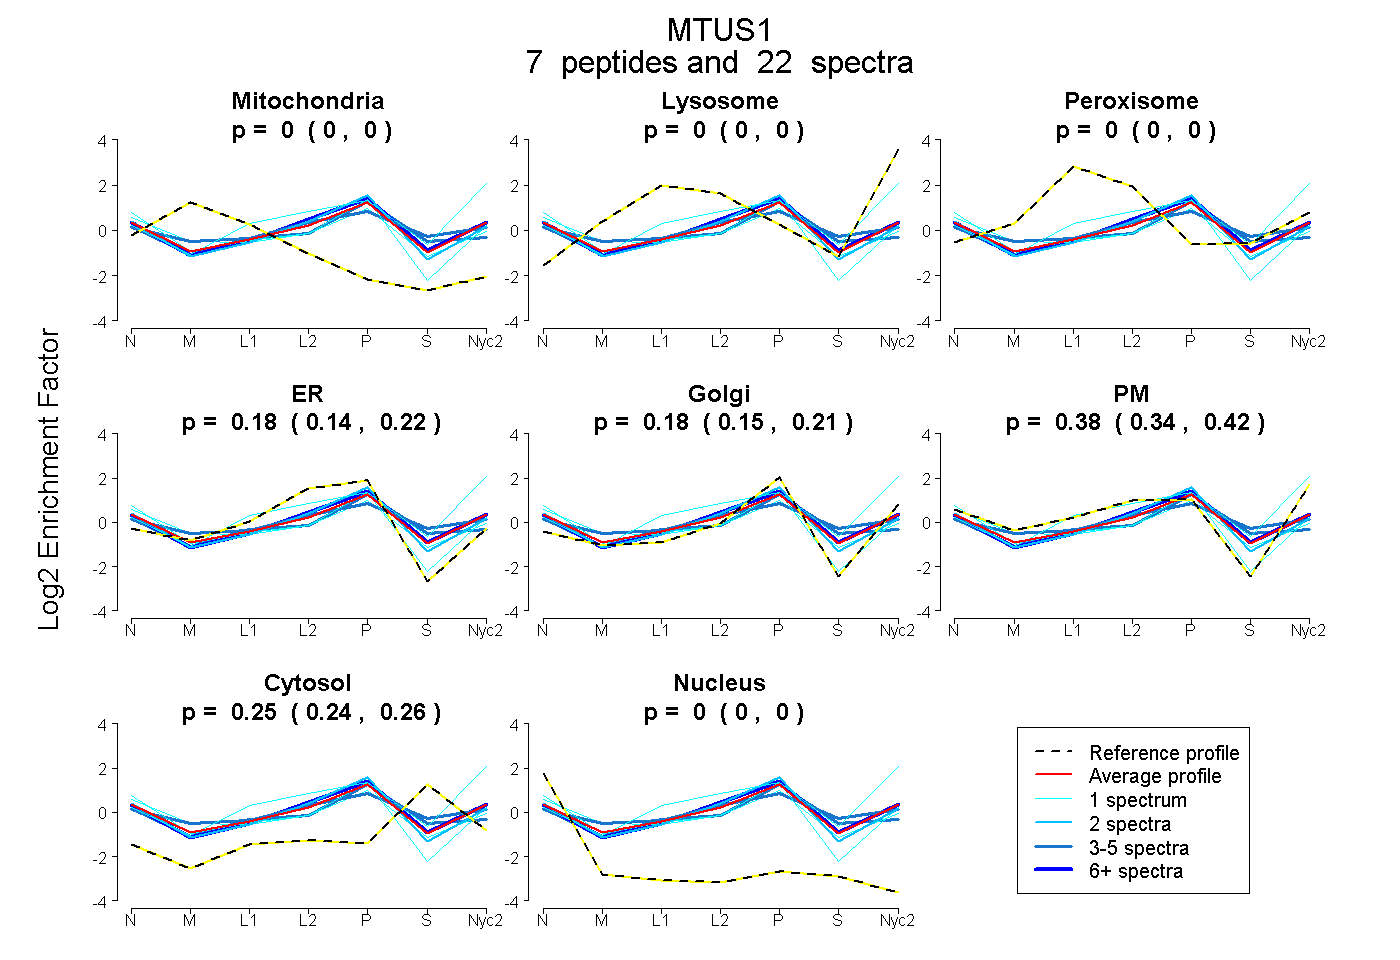
0.000 | 0.000
0.000 | 0.000
0.000 | 0.000
0.140 | 0.224
0.147 | 0.207
0.344 | 0.415
0.239 | 0.265
0.000 | 0.000
| Plot | Mito | Lyso | Perox | ER | Golgi | PM | Cytosol | Nucleus | |||||
| Expt A |
7 peptides |
22 spectra |
|
0.000 0.000 | 0.000 |
0.000 0.000 | 0.000 |
0.000 0.000 | 0.000 |
0.185 0.140 | 0.224 |
0.180 0.147 | 0.207 |
0.382 0.344 | 0.415 |
0.253 0.239 | 0.265 |
0.000 0.000 | 0.000 |
| 8 spectra, FQQENEELK | 0.000 | 0.000 | 0.000 | 0.245 | 0.182 | 0.329 | 0.244 | 0.000 | ||
| 1 spectrum, SHEMEK | 0.000 | 0.241 | 0.000 | 0.000 | 0.085 | 0.515 | 0.159 | 0.000 | ||
| 4 spectra, LLENLLNEK | 0.000 | 0.000 | 0.126 | 0.149 | 0.124 | 0.280 | 0.321 | 0.000 | ||
| 1 spectrum, GELVAASSTCEK | 0.075 | 0.000 | 0.000 | 0.113 | 0.217 | 0.356 | 0.190 | 0.050 | ||
| 2 spectra, SENDALNER | 0.000 | 0.000 | 0.000 | 0.310 | 0.276 | 0.218 | 0.184 | 0.012 | ||
| 1 spectrum, LSMENEELLWK | 0.000 | 0.000 | 0.000 | 0.111 | 0.363 | 0.381 | 0.000 | 0.145 | ||
| 5 spectra, EFYTAECEK | 0.000 | 0.000 | 0.096 | 0.233 | 0.353 | 0.005 | 0.298 | 0.013 |
| Plot | Lyso | Other | |||||||||||
| Expt C |
9 peptides |
25 spectra |
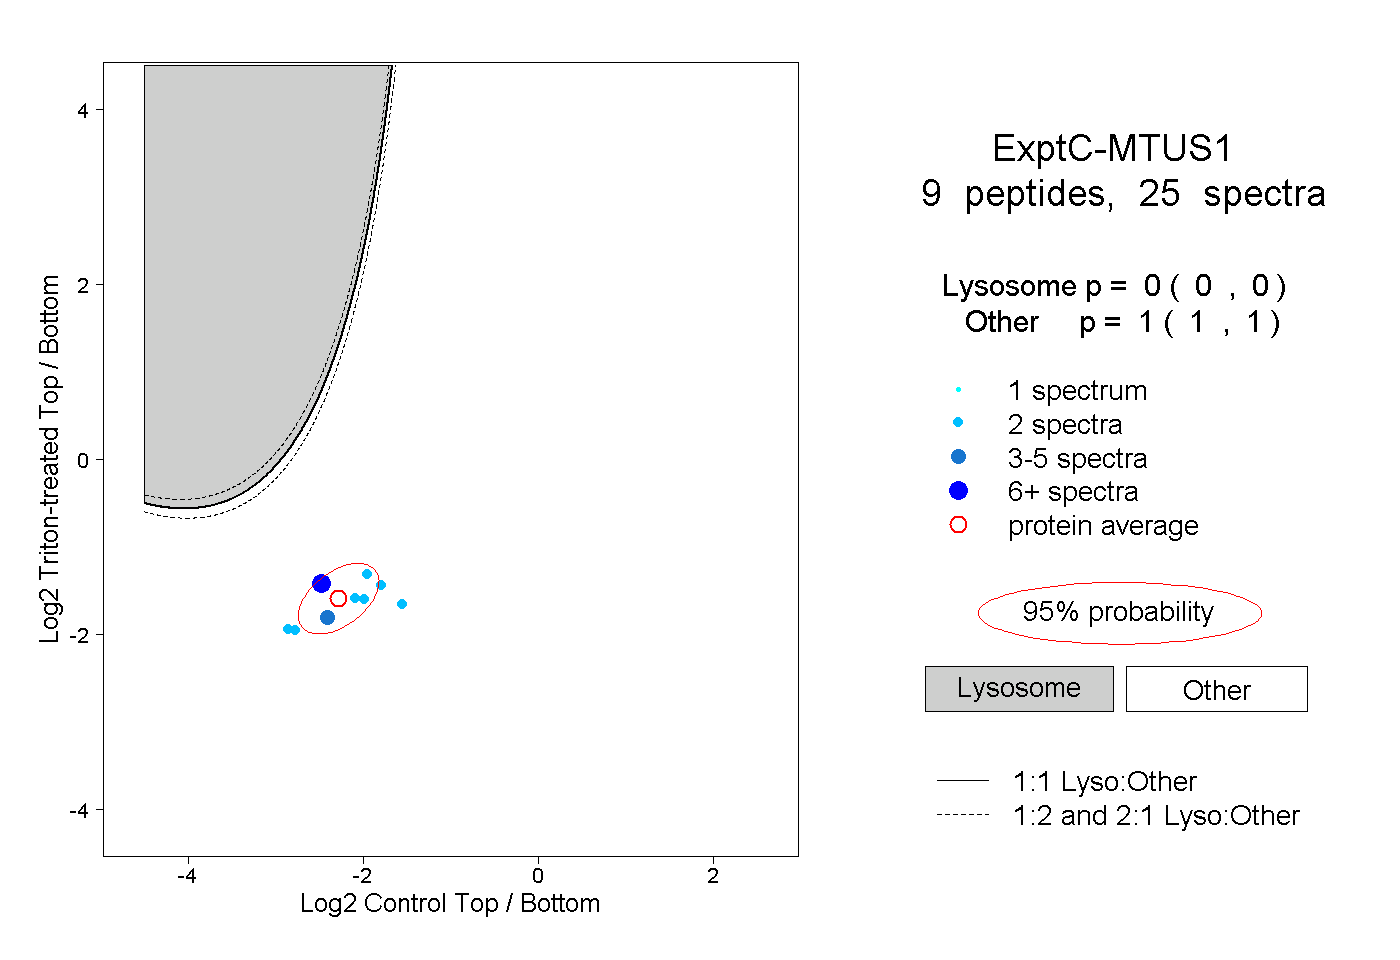 |
0.000 0.000 | 0.000 |
1.000 1.000 | 1.000 |