 5
5peptides
spectra
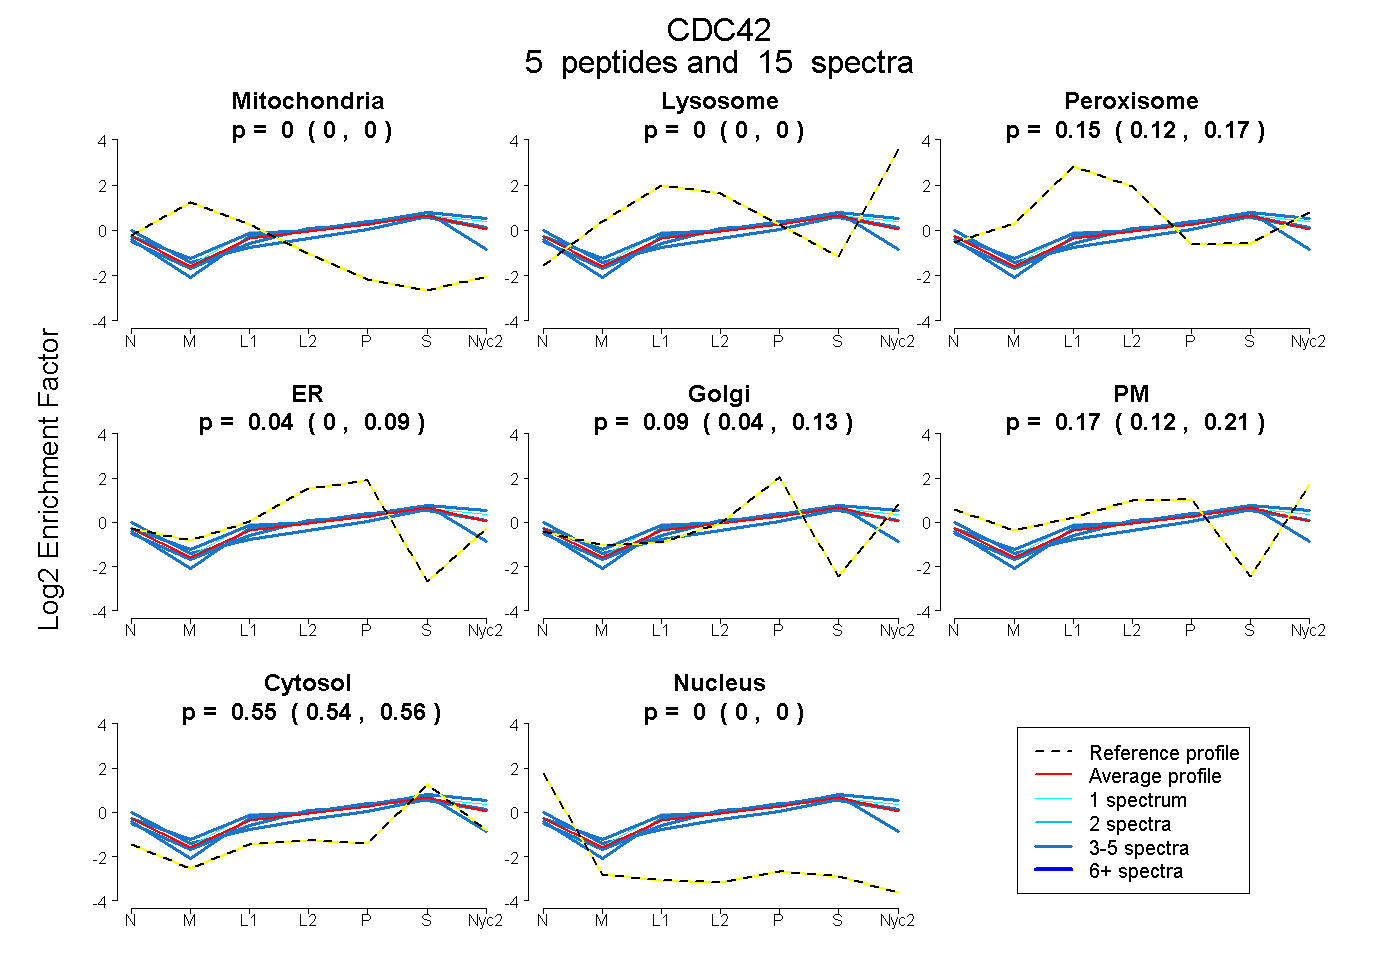
0.000 | 0.000
0.000 | 0.000
0.122 | 0.169
0.000 | 0.091
0.039 | 0.132
0.121 | 0.206
0.535 | 0.564
0.000 | 0.000
2peptides
spectra
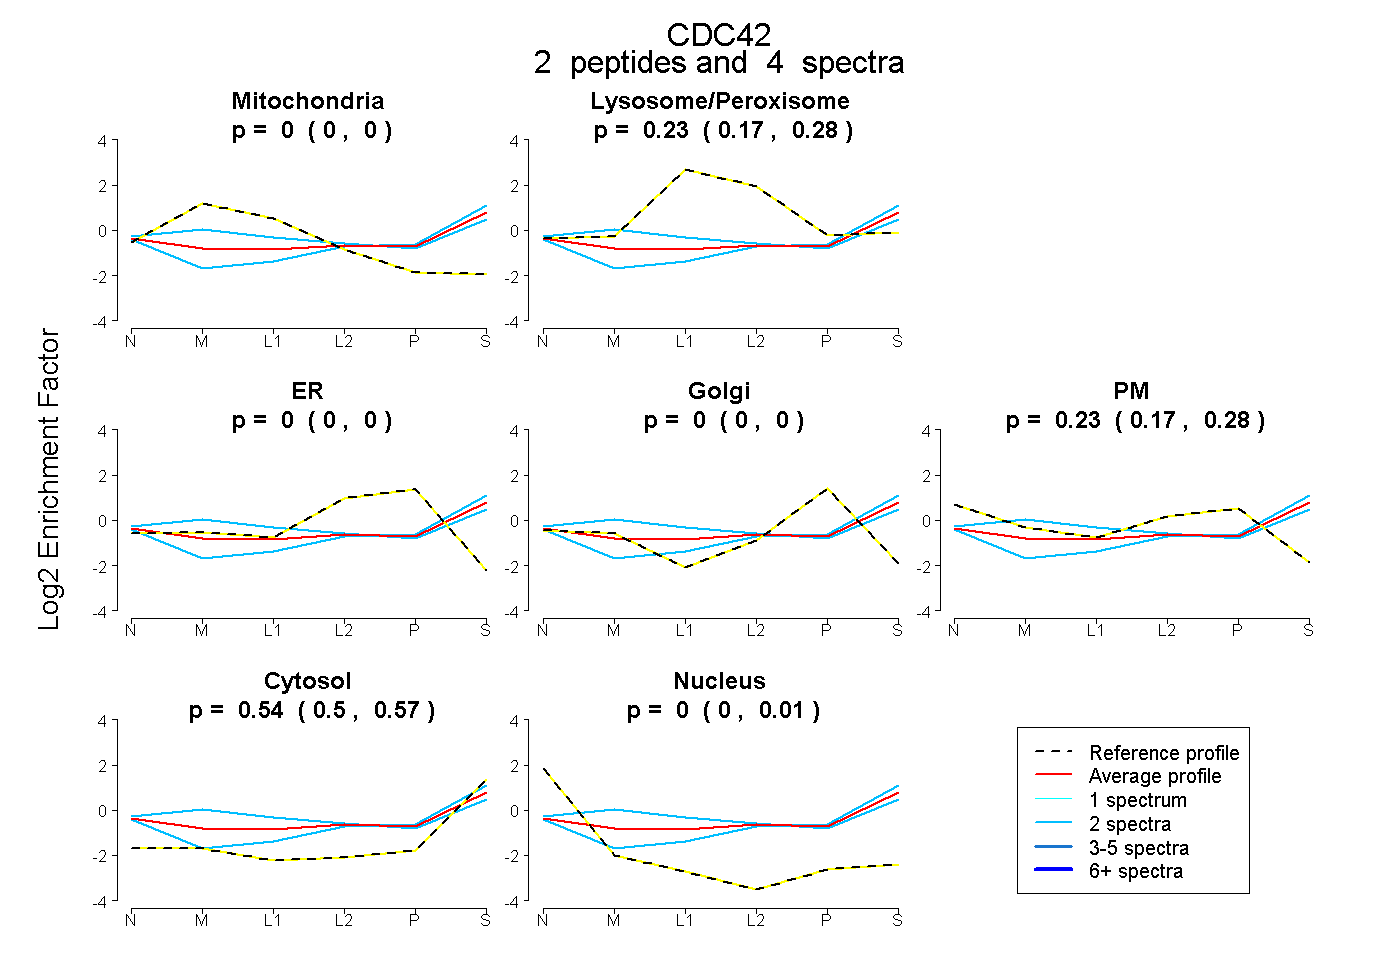
0.000 | 0.004
0.173 | 0.276
0.000 | 0.000
0.000 | 0.000
0.166 | 0.279
0.496 | 0.568
0.000 | 0.014
4peptides
spectra
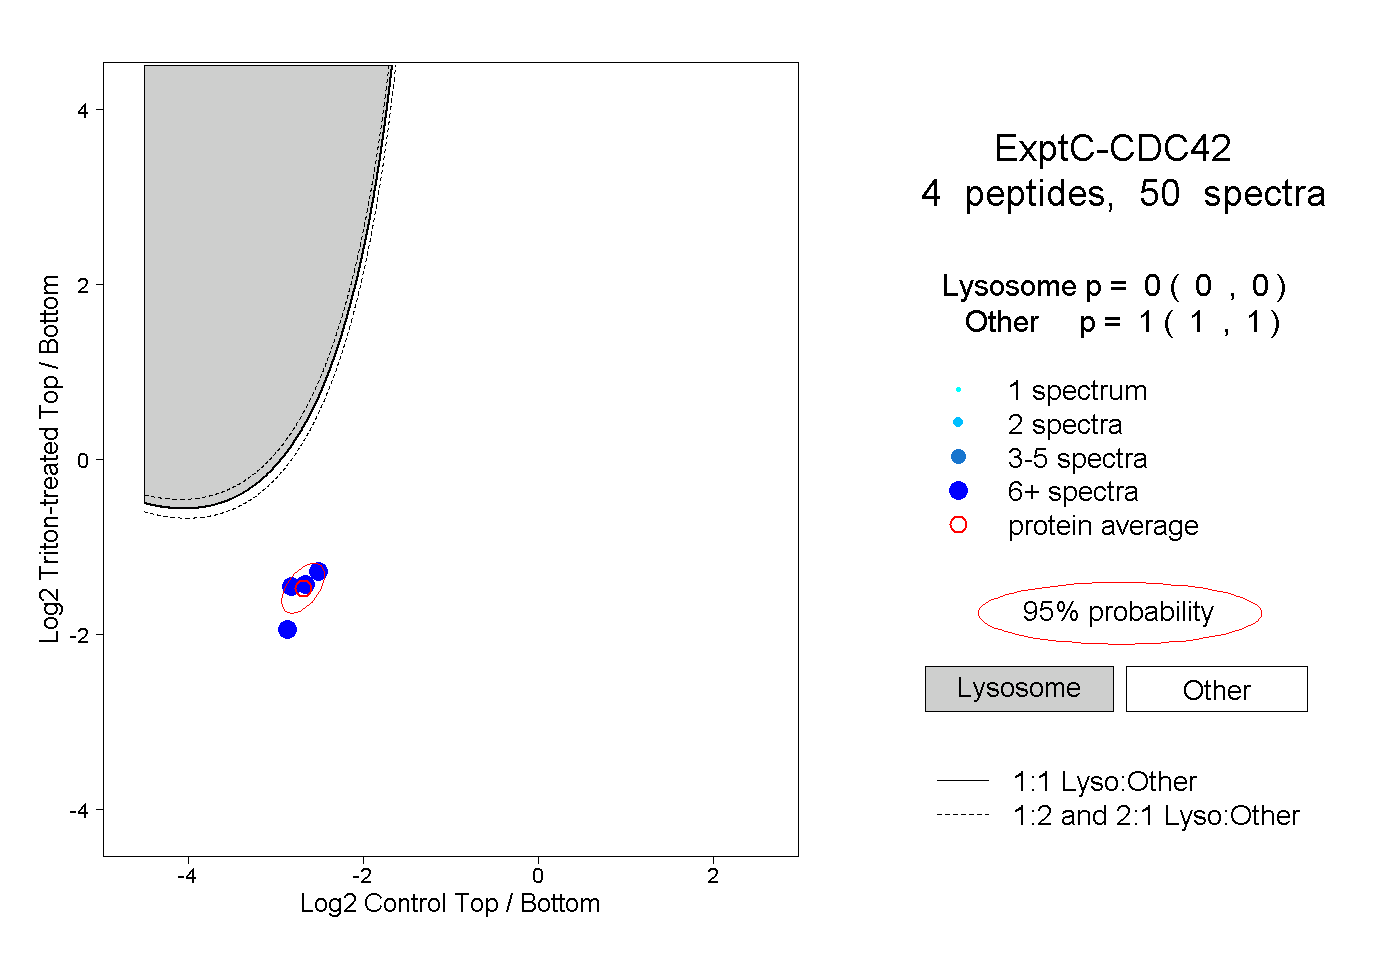
0.000 | 0.000
1.000 | 1.000
1peptide
spectrum
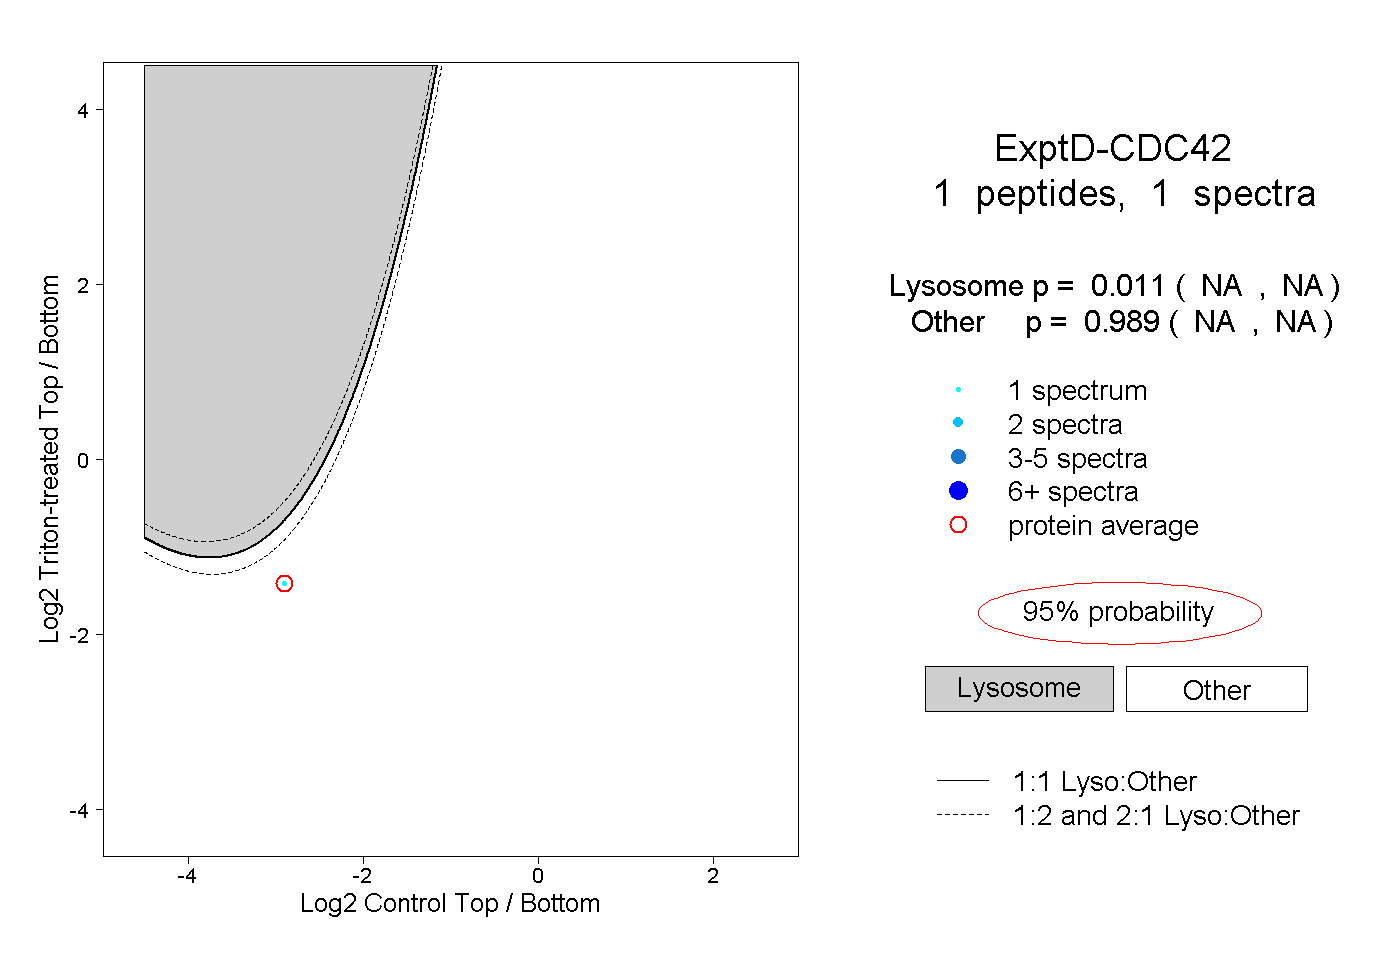
NA | NA
NA | NA