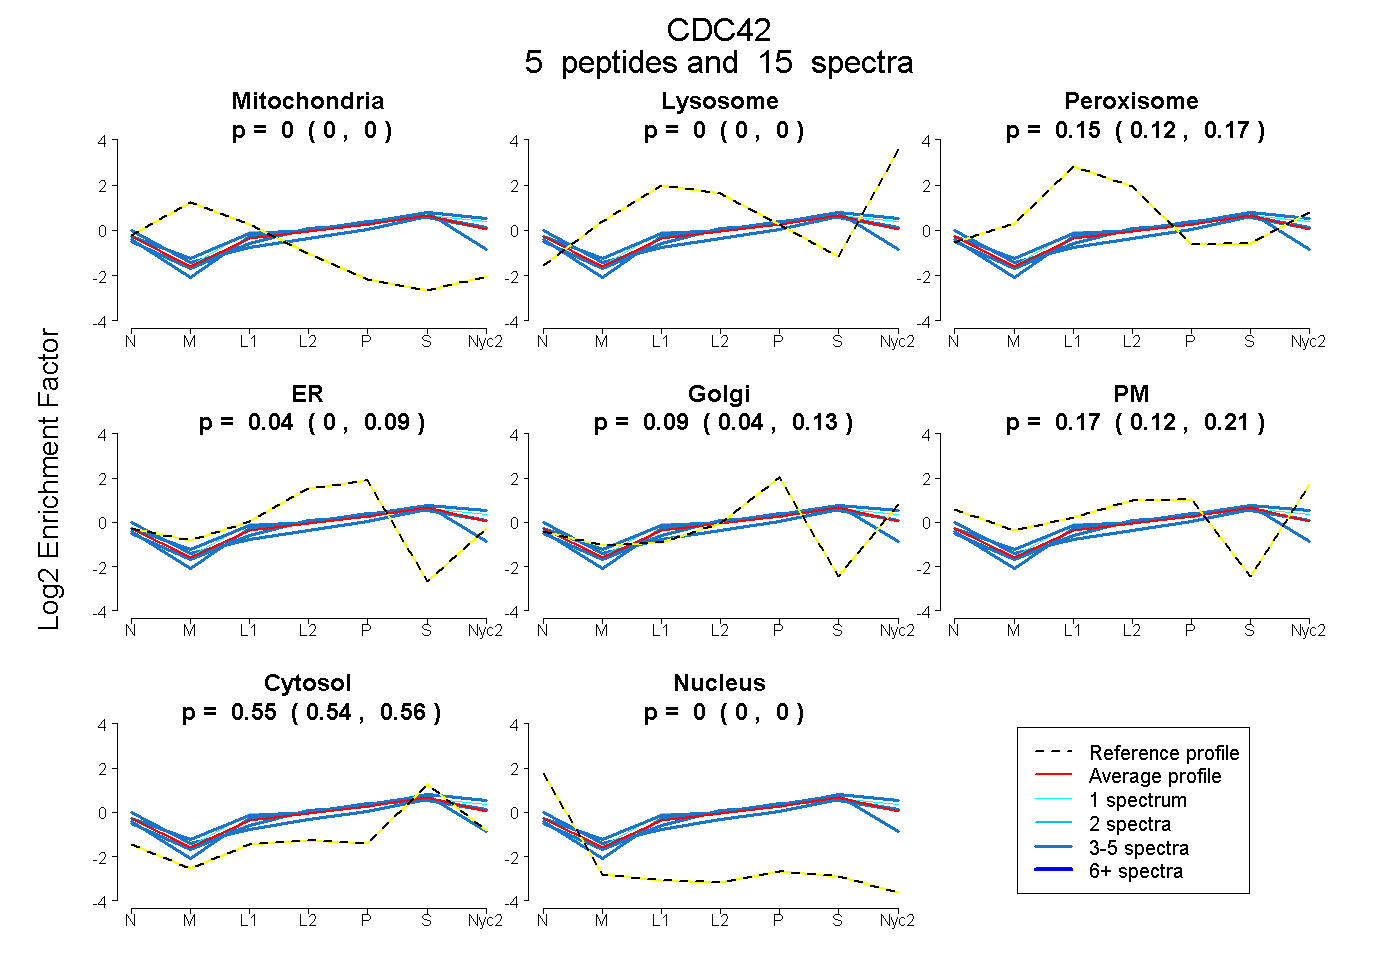
 5
5peptides
spectra
0.000 | 0.000
0.000 | 0.000
0.122 | 0.169
0.000 | 0.091
0.039 | 0.132
0.121 | 0.206
0.535 | 0.564
0.000 | 0.000
| Plot | Mito | Lyso | Perox | ER | Golgi | PM | Cytosol | Nucleus | |||||
| Expt A |
5 peptides |
15 spectra |
|
0.000 0.000 | 0.000 |
0.000 0.000 | 0.000 |
0.149 0.122 | 0.169 |
0.042 0.000 | 0.091 |
0.093 0.039 | 0.132 |
0.166 0.121 | 0.206 |
0.550 0.535 | 0.564 |
0.000 0.000 | 0.000 |
| 4 spectra, YVECSALTQK | 0.000 | 0.000 | 0.097 | 0.286 | 0.000 | 0.000 | 0.617 | 0.000 | ||
| 3 spectra, WVPEITHHCPK | 0.000 | 0.000 | 0.253 | 0.000 | 0.230 | 0.060 | 0.457 | 0.000 | ||
| 3 spectra, TPFLLVGTQIDLR | 0.000 | 0.132 | 0.000 | 0.031 | 0.000 | 0.249 | 0.588 | 0.000 | ||
| 4 spectra, DDPSTIEK | 0.000 | 0.000 | 0.028 | 0.000 | 0.000 | 0.369 | 0.602 | 0.000 | ||
| 1 spectrum, NVFDEAILAALEPPEPK | 0.000 | 0.009 | 0.202 | 0.000 | 0.116 | 0.182 | 0.491 | 0.000 |
| Plot | Mito | Lyso or Perox | ER | Golgi | PM | Cytosol | Nucleus | ||||||
| Expt B |
2 peptides |
4 spectra |
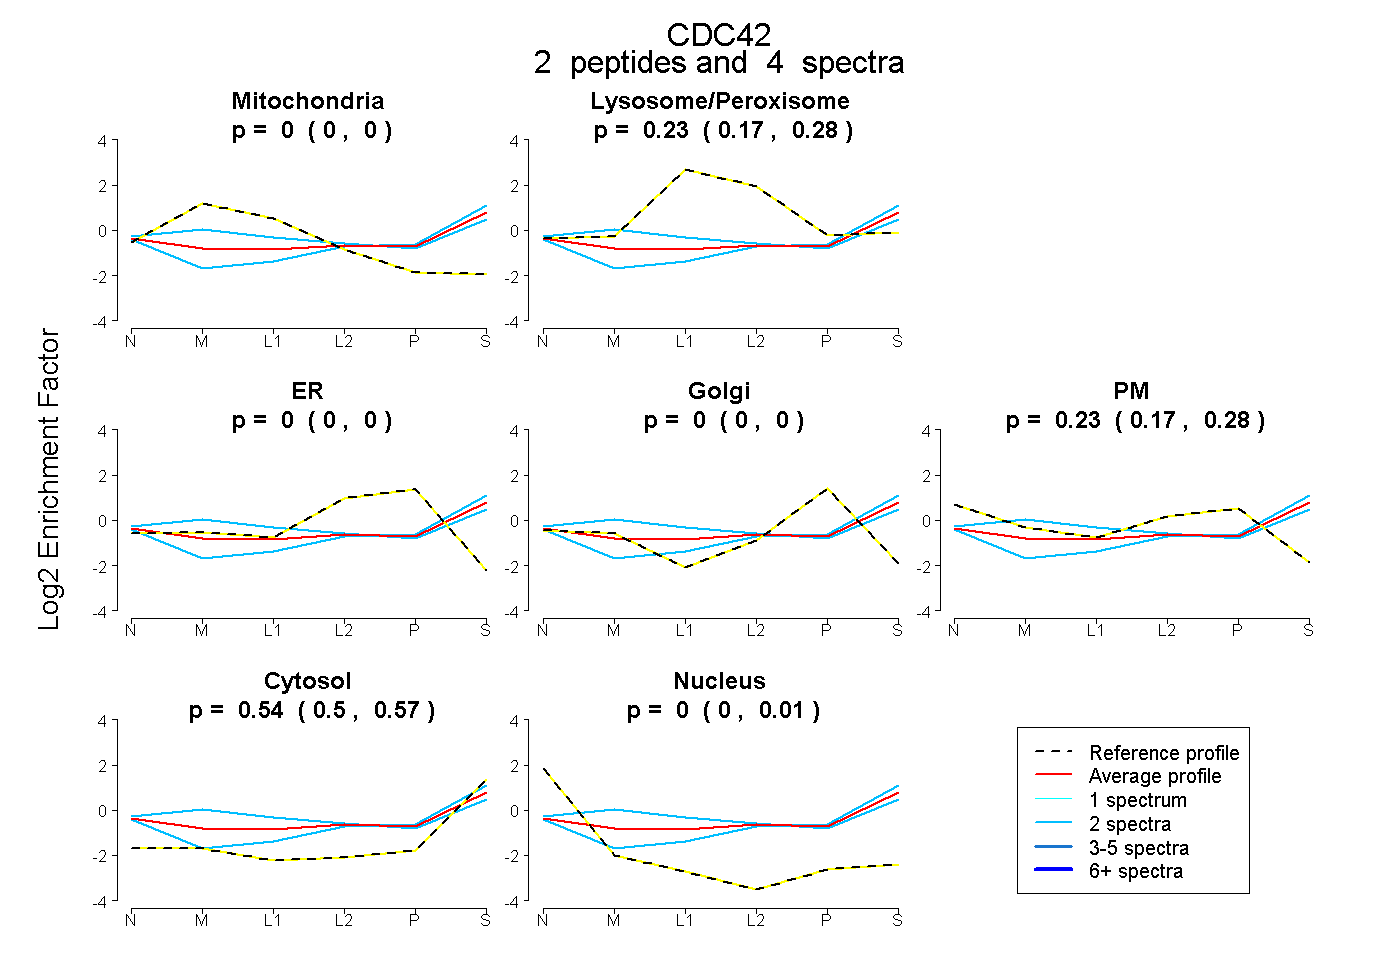 |
0.000 0.000 | 0.004 |
0.228 0.173 | 0.276 |
0.000 0.000 | 0.000 |
0.000 0.000 | 0.000 |
0.234 0.166 | 0.279 |
0.538 0.496 | 0.568 |
0.000 0.000 | 0.014 |
|||
| Plot | Lyso | Other | |||||||||||
| Expt C |
4 peptides |
50 spectra |
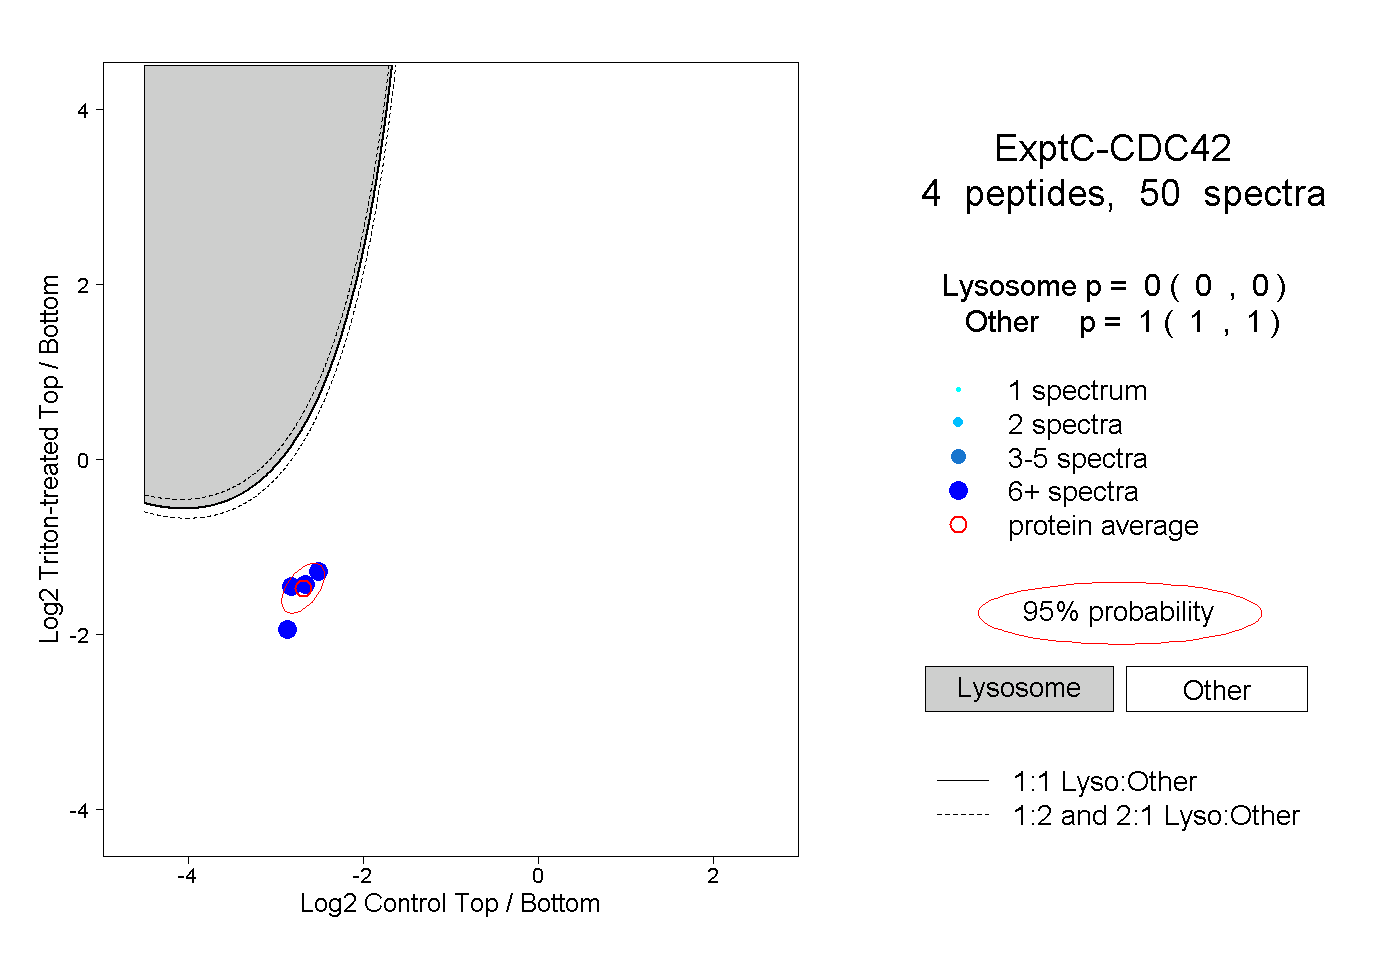 |
0.000 0.000 | 0.000 |
1.000 1.000 | 1.000 |
||||||||
| Plot | Lyso | Other | |||||||||||
| Expt D |
1 peptide |
1 spectrum |
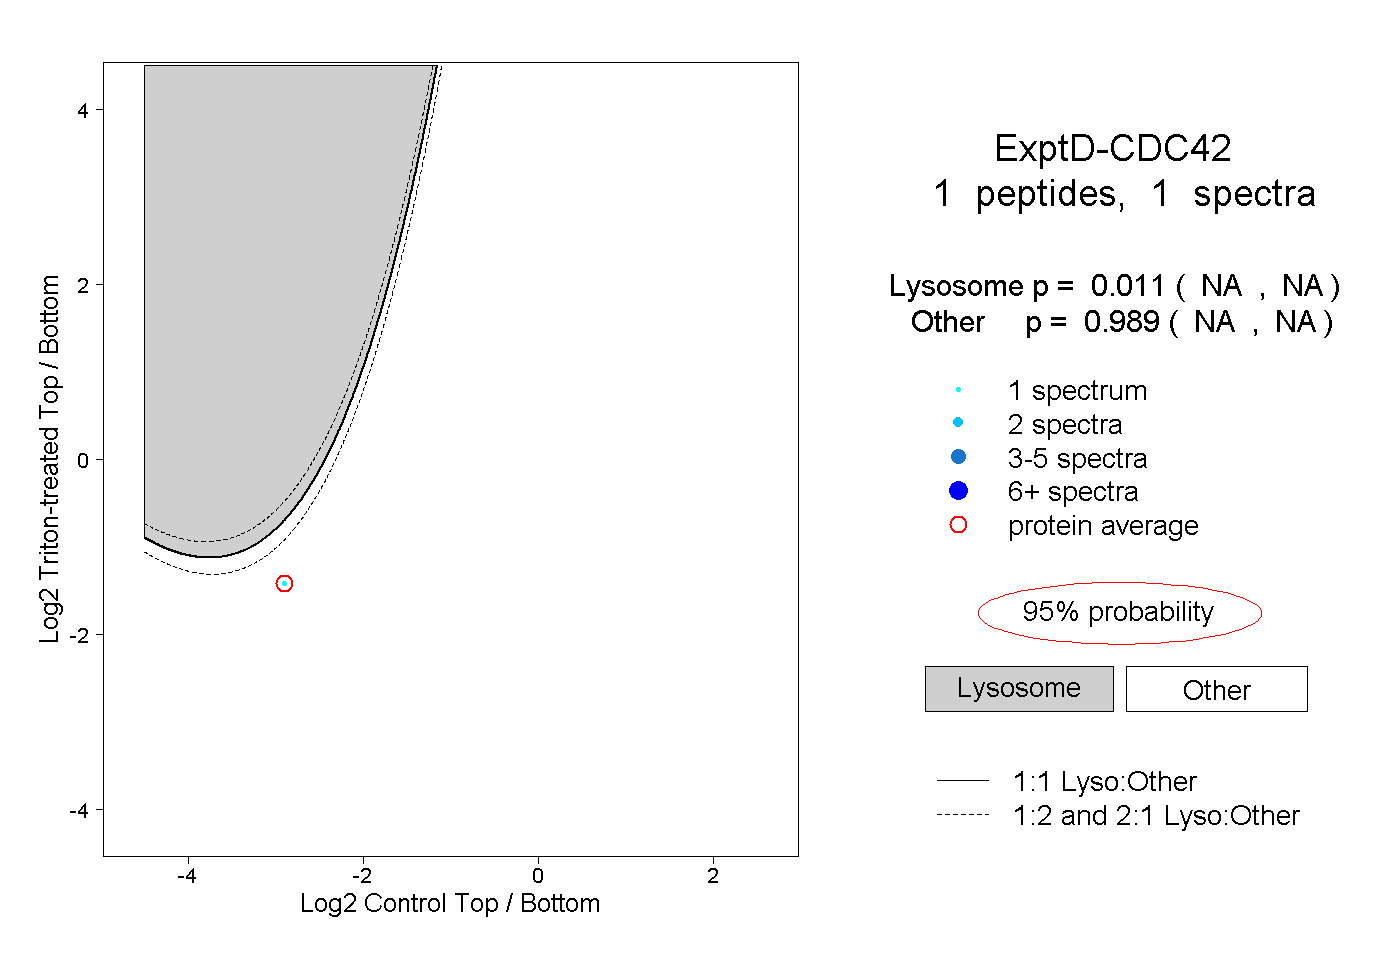 |
0.011 NA | NA |
0.989 NA | NA |