 10
10peptides
spectra
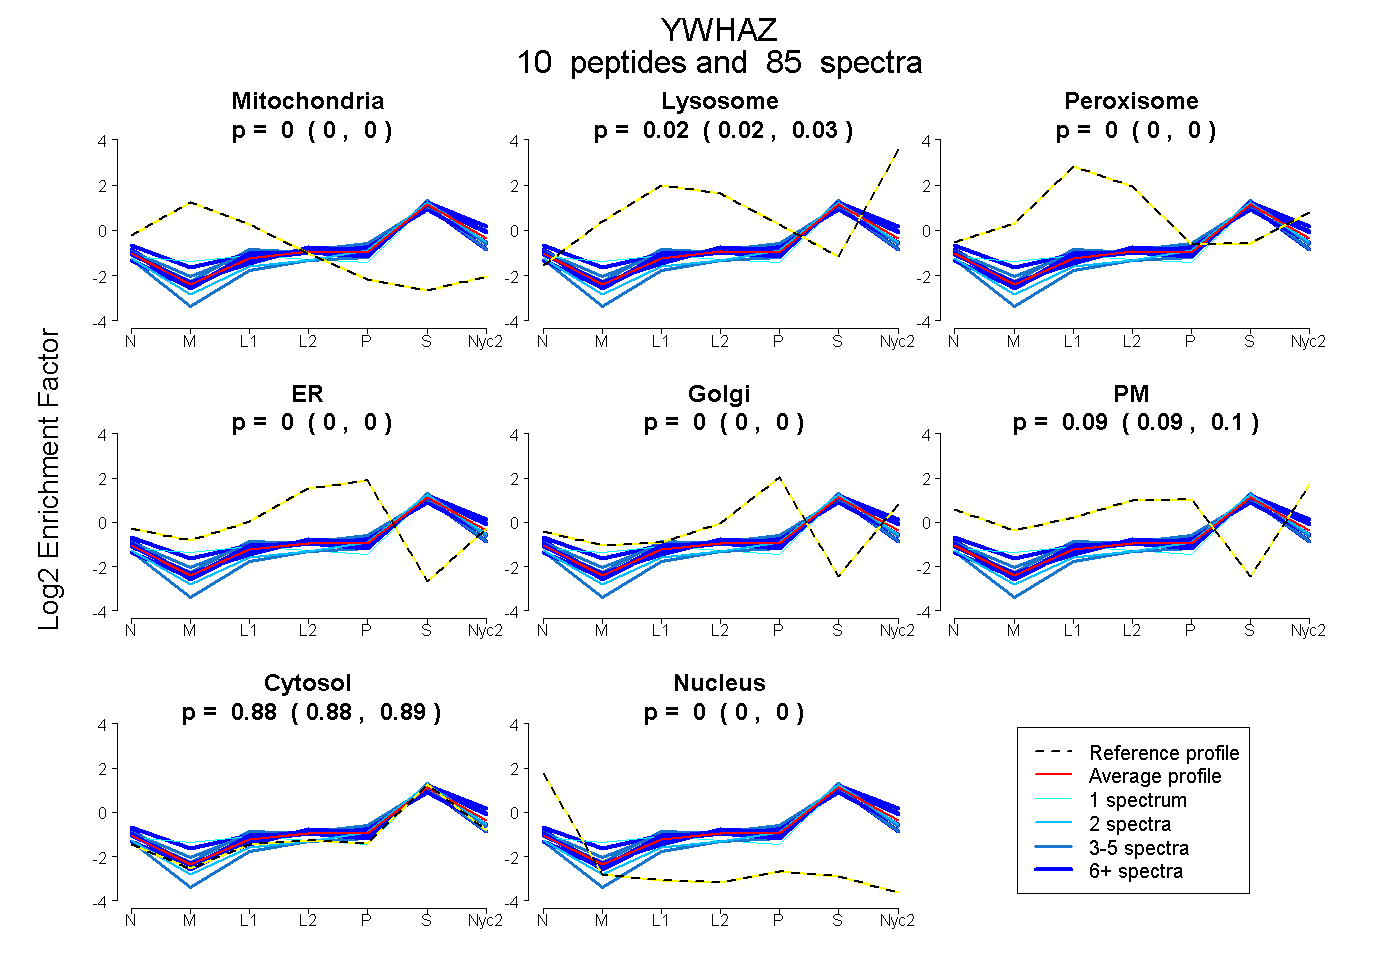
0.000 | 0.000
0.017 | 0.028
0.000 | 0.000
0.000 | 0.000
0.000 | 0.000
0.088 | 0.097
0.881 | 0.886
0.000 | 0.000
7peptides
spectra
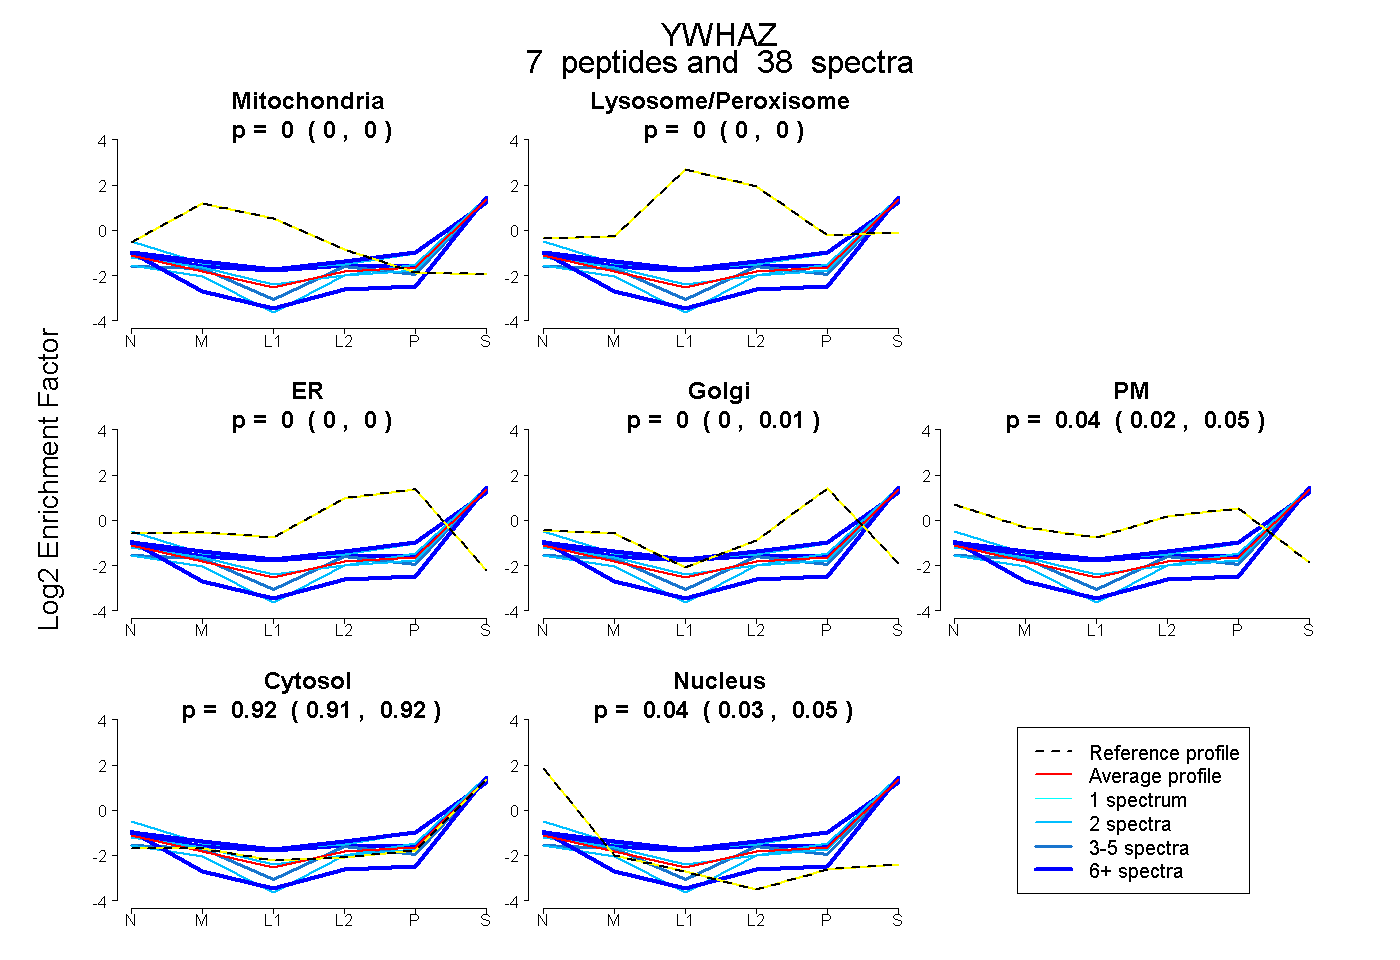
0.000 | 0.000
0.000 | 0.000
0.000 | 0.000
0.000 | 0.007
0.021 | 0.050
0.909 | 0.923
0.033 | 0.054
6peptides
spectra
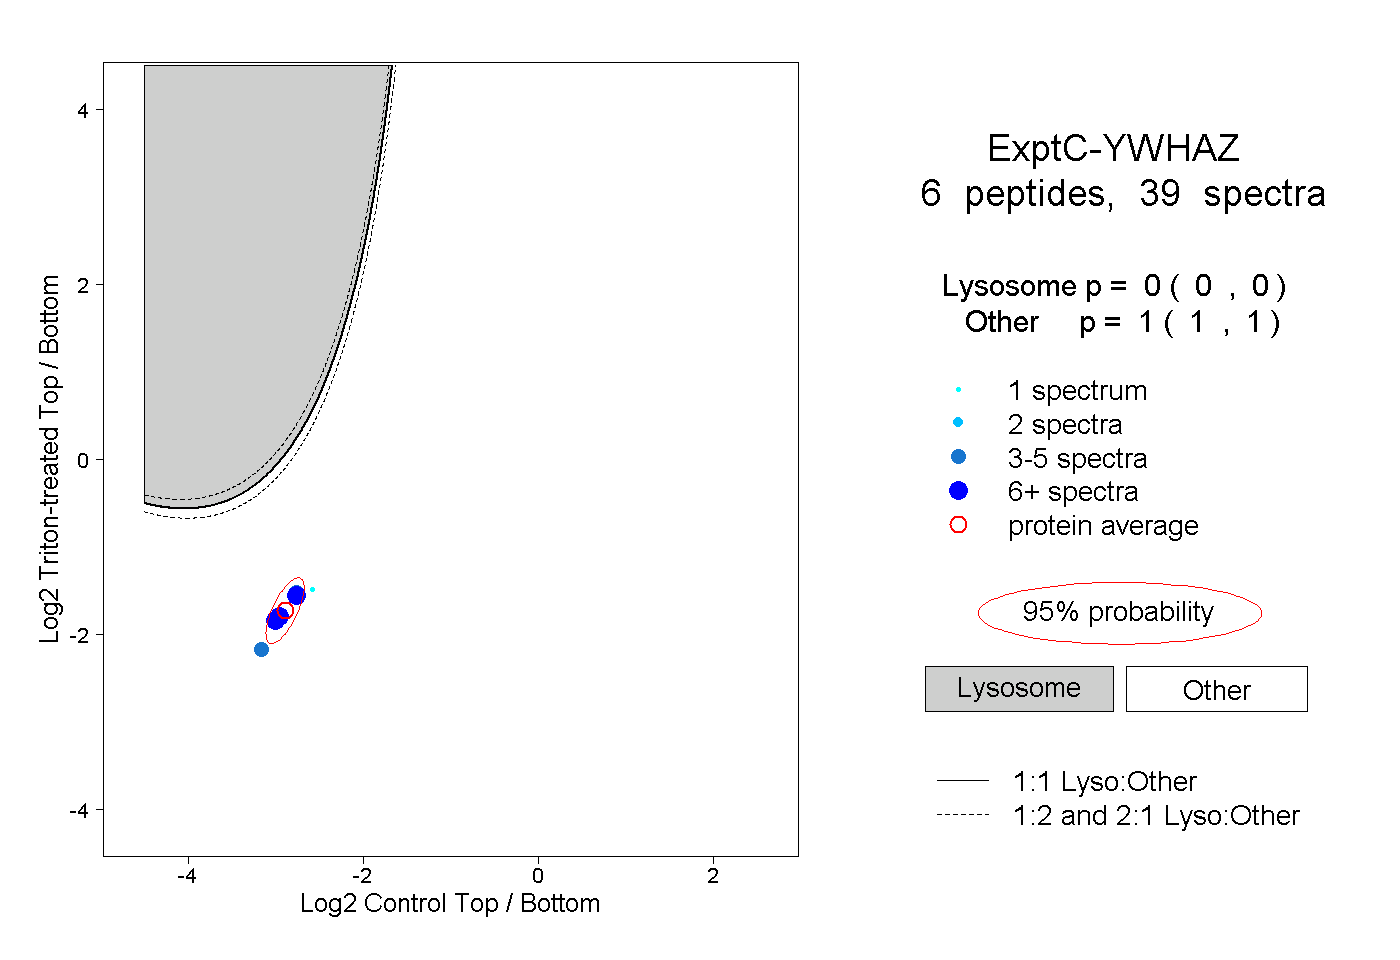
0.000 | 0.000
1.000 | 1.000
2peptides
spectra
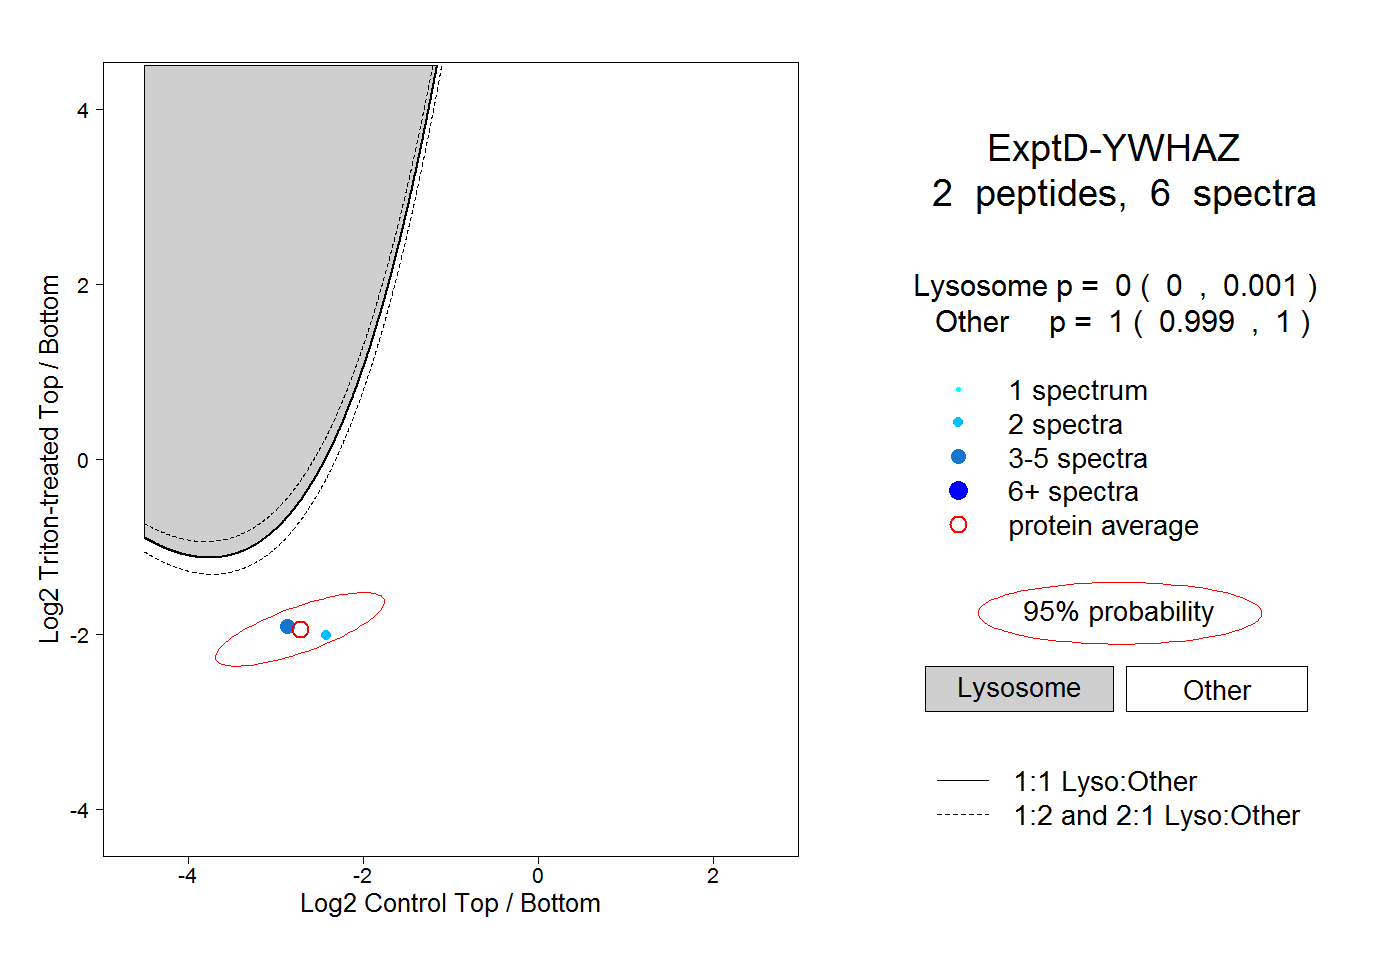
0.000 | 0.001
0.999 | 1.000