 10
10peptides
spectra
0.000 | 0.000
0.017 | 0.028
0.000 | 0.000
0.000 | 0.000
0.000 | 0.000
0.088 | 0.097
0.881 | 0.886
0.000 | 0.000
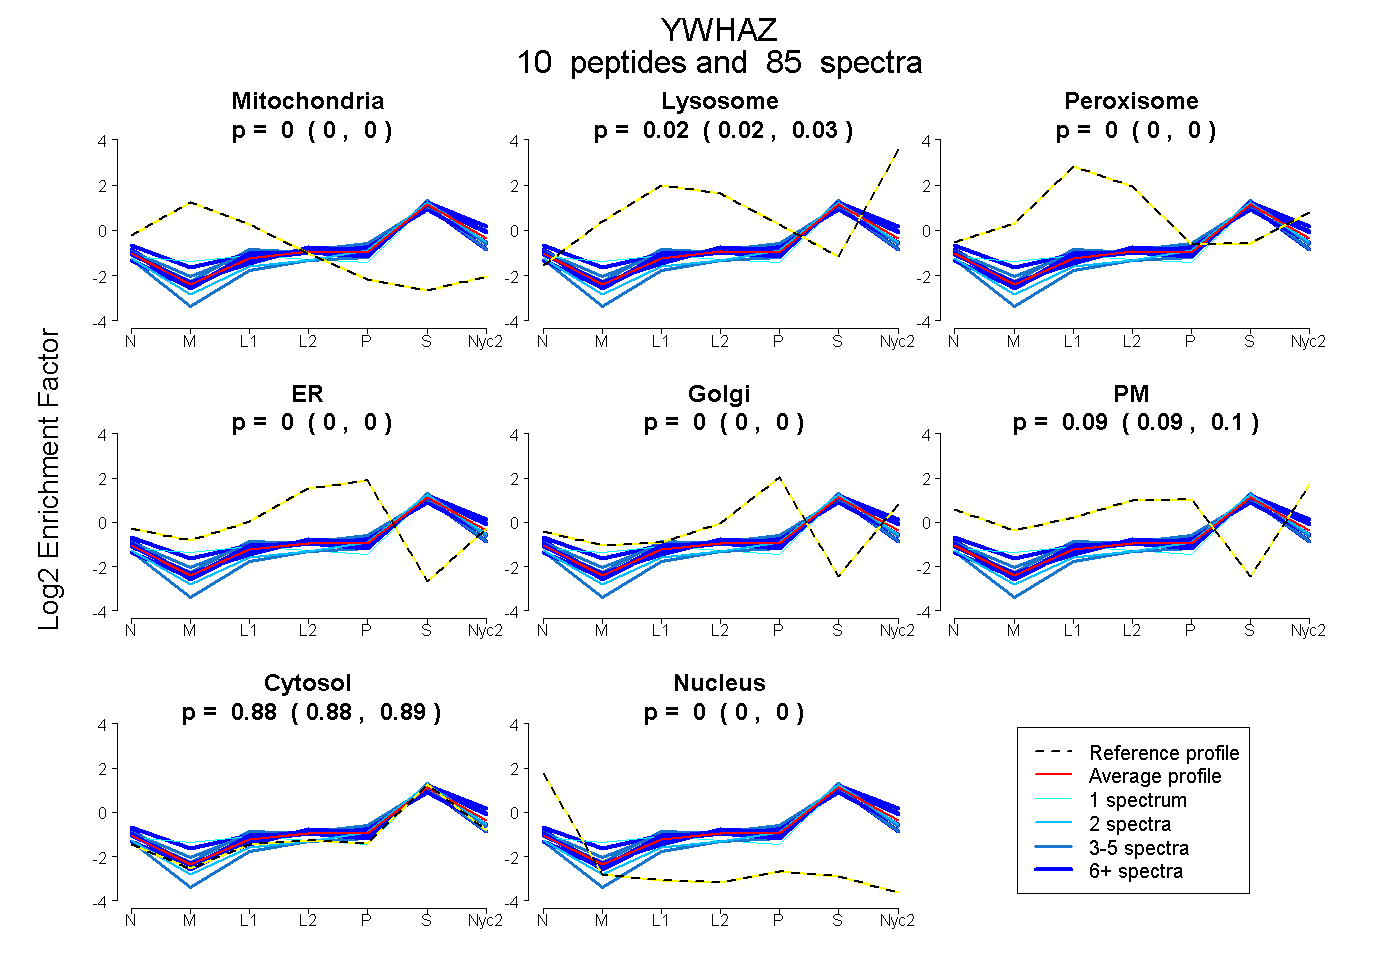
| Plot | Mito | Lyso | Perox | ER | Golgi | PM | Cytosol | Nucleus | |||||
| Expt A |
10 peptides |
85 spectra |
|
0.000 0.000 | 0.000 |
0.023 0.017 | 0.028 |
0.000 0.000 | 0.000 |
0.000 0.000 | 0.000 |
0.000 0.000 | 0.000 |
0.093 0.088 | 0.097 |
0.883 0.881 | 0.886 |
0.000 0.000 | 0.000 |
| 10 spectra, SVTEQGAELSNEER | 0.000 | 0.047 | 0.000 | 0.000 | 0.000 | 0.076 | 0.877 | 0.000 | ||
| 10 spectra, EMQPTHPIR | 0.025 | 0.000 | 0.037 | 0.000 | 0.013 | 0.149 | 0.776 | 0.000 | ||
| 5 spectra, DICNDVLSLLEK | 0.000 | 0.000 | 0.081 | 0.051 | 0.000 | 0.000 | 0.864 | 0.003 | ||
| 2 spectra, YLAEVAAGDDK | 0.000 | 0.000 | 0.000 | 0.000 | 0.052 | 0.000 | 0.948 | 0.000 | ||
| 4 spectra, VVSSIEQK | 0.000 | 0.000 | 0.000 | 0.000 | 0.000 | 0.000 | 0.994 | 0.006 | ||
| 10 spectra, ACSLAK | 0.000 | 0.000 | 0.000 | 0.084 | 0.000 | 0.019 | 0.882 | 0.016 | ||
| 26 spectra, YDDMAACMK | 0.000 | 0.126 | 0.000 | 0.000 | 0.000 | 0.000 | 0.874 | 0.000 | ||
| 14 spectra, NVVGAR | 0.000 | 0.041 | 0.000 | 0.000 | 0.000 | 0.094 | 0.865 | 0.000 | ||
| 3 spectra, FLIPNASQPESK | 0.000 | 0.076 | 0.000 | 0.000 | 0.020 | 0.105 | 0.798 | 0.000 | ||
| 1 spectrum, GIVDQSQQAYQEAFEISK | 0.073 | 0.114 | 0.000 | 0.000 | 0.000 | 0.000 | 0.813 | 0.000 |
| Plot | Mito | Lyso or Perox | ER | Golgi | PM | Cytosol | Nucleus | ||||||
| Expt B |
7 peptides |
38 spectra |
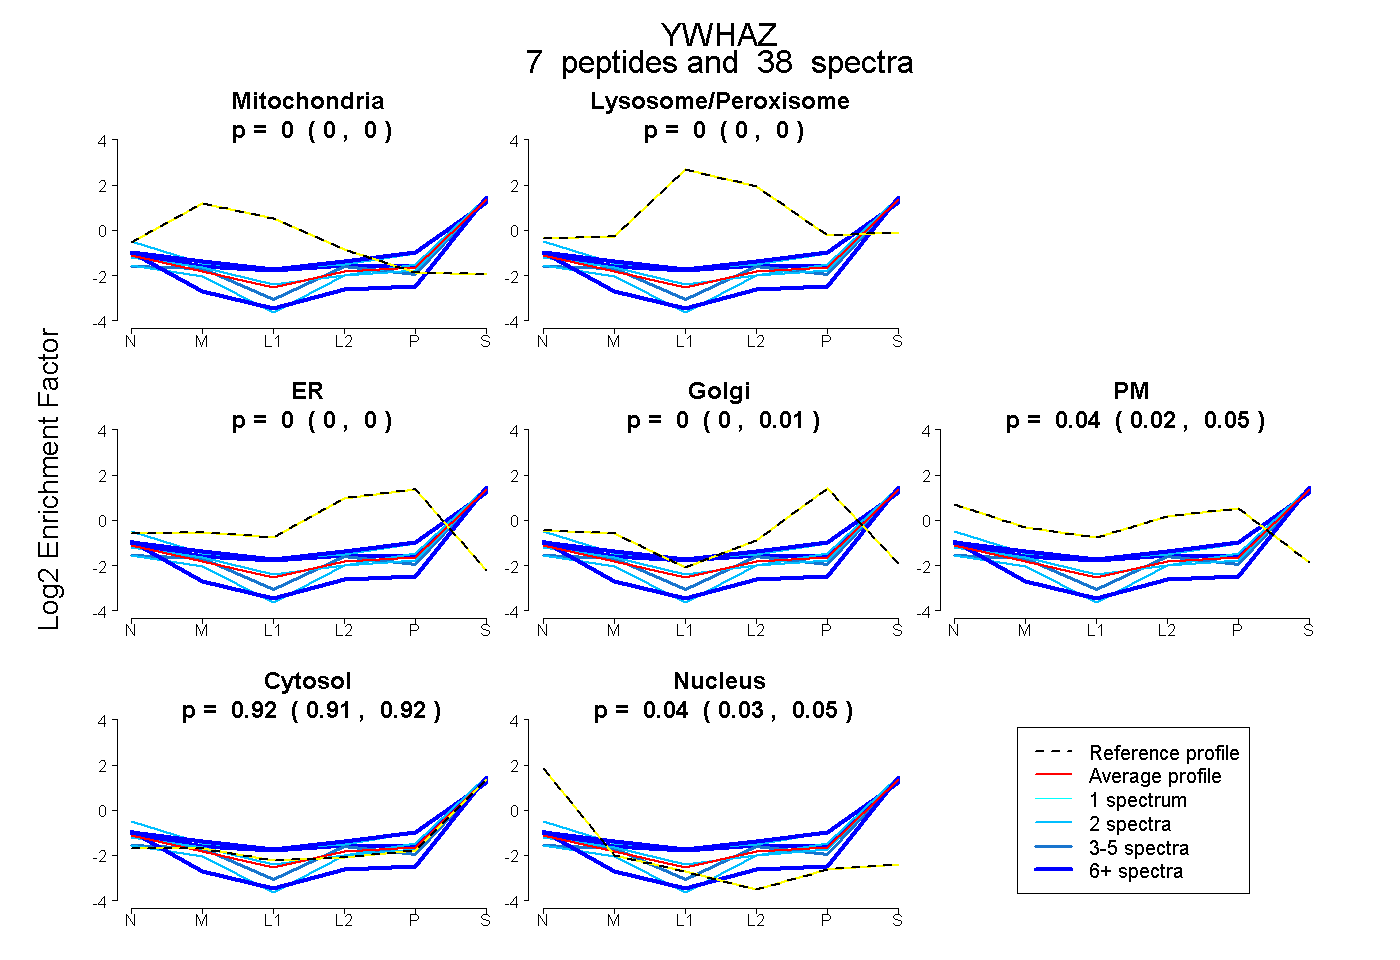 |
0.000 0.000 | 0.000 |
0.000 0.000 | 0.000 |
0.000 0.000 | 0.000 |
0.000 0.000 | 0.007 |
0.038 0.021 | 0.050 |
0.917 0.909 | 0.923 |
0.045 0.033 | 0.054 |
|||
| Plot | Lyso | Other | |||||||||||
| Expt C |
6 peptides |
39 spectra |
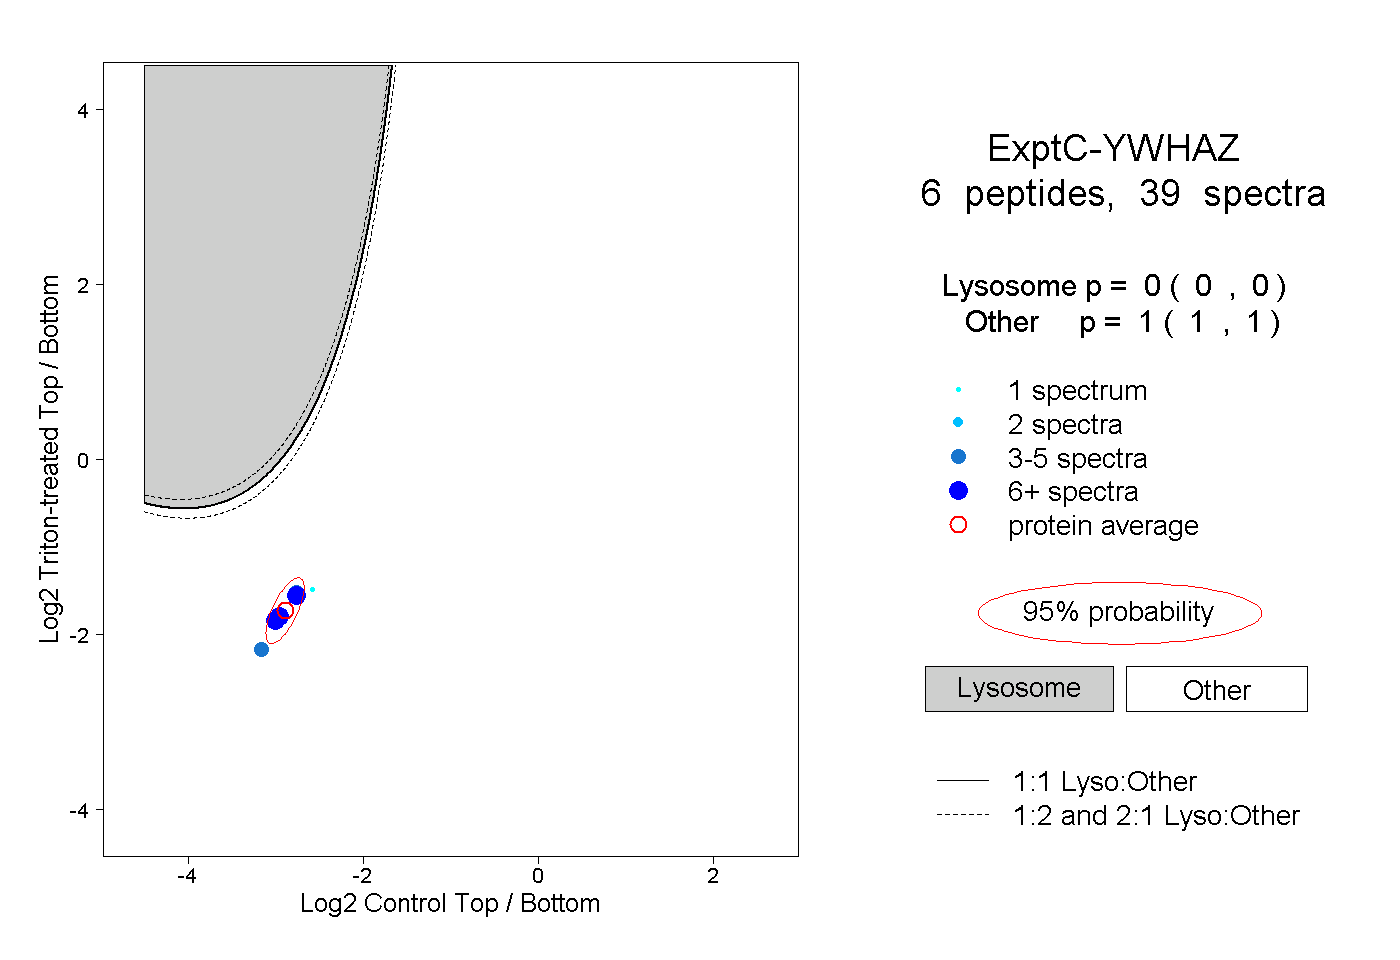 |
0.000 0.000 | 0.000 |
1.000 1.000 | 1.000 |
||||||||
| Plot | Lyso | Other | |||||||||||
| Expt D |
2 peptides |
6 spectra |
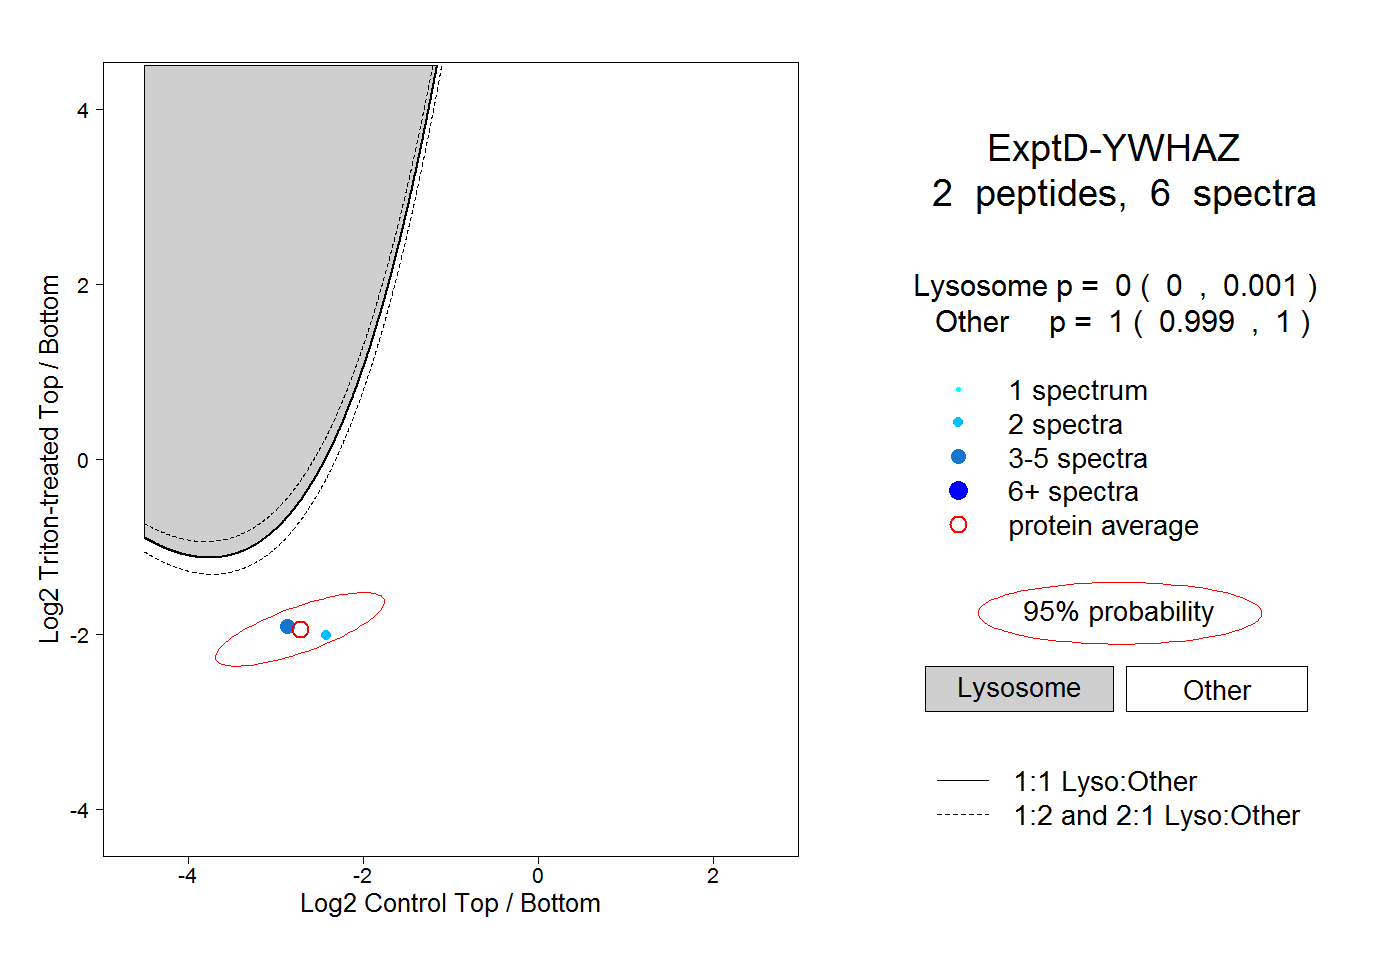 |
0.000 0.000 | 0.001 |
1.000 0.999 | 1.000 |