 4
4peptides
spectra
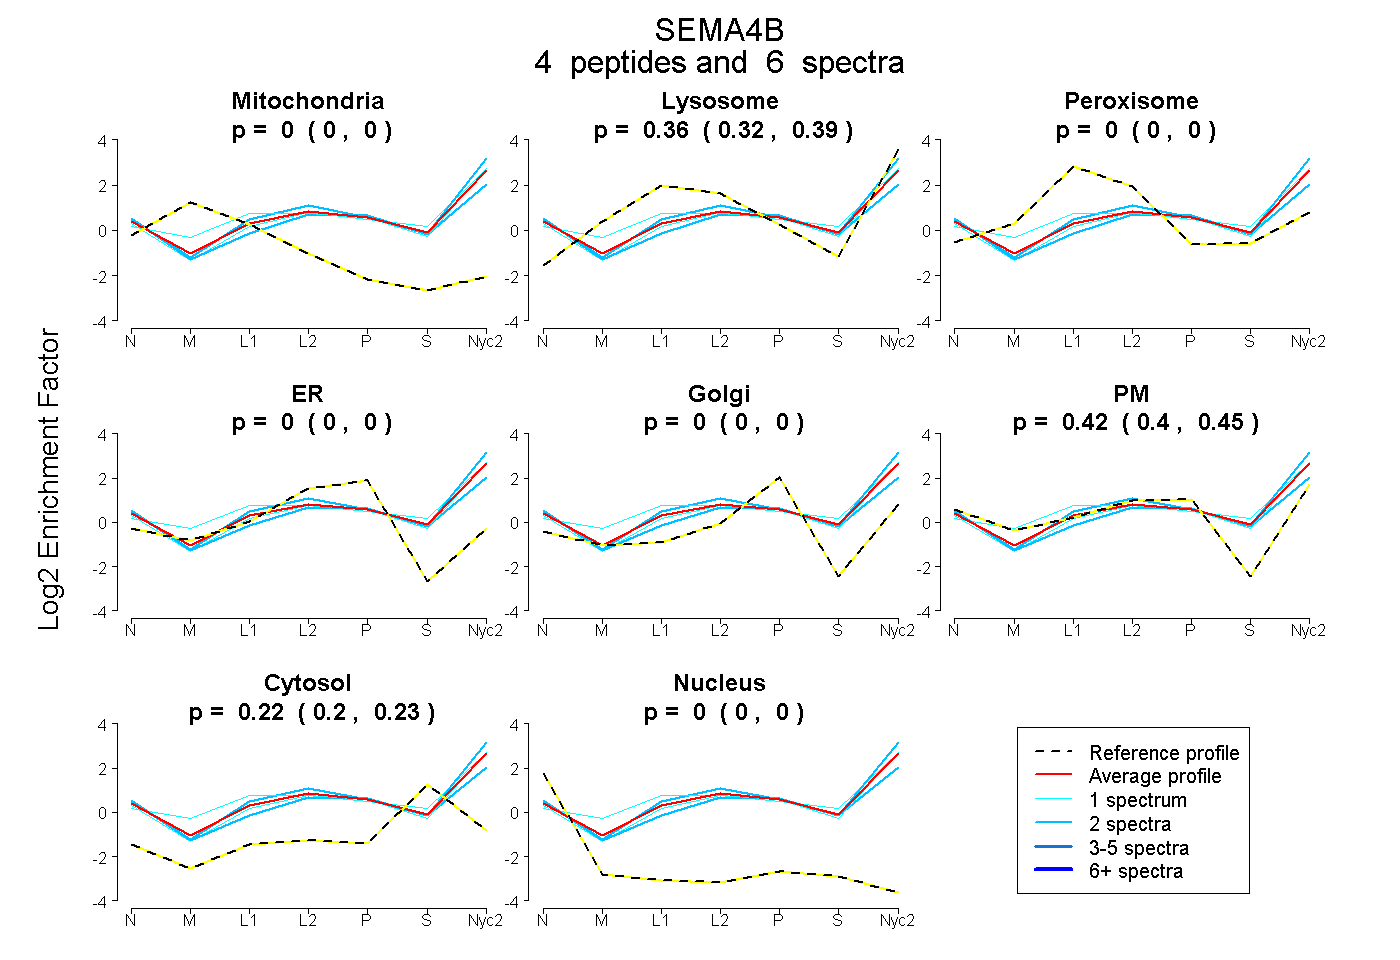
0.000 | 0.000
0.321 | 0.389
0.000 | 0.000
0.000 | 0.000
0.000 | 0.000
0.396 | 0.446
0.202 | 0.233
0.000 | 0.000
2peptides
spectra
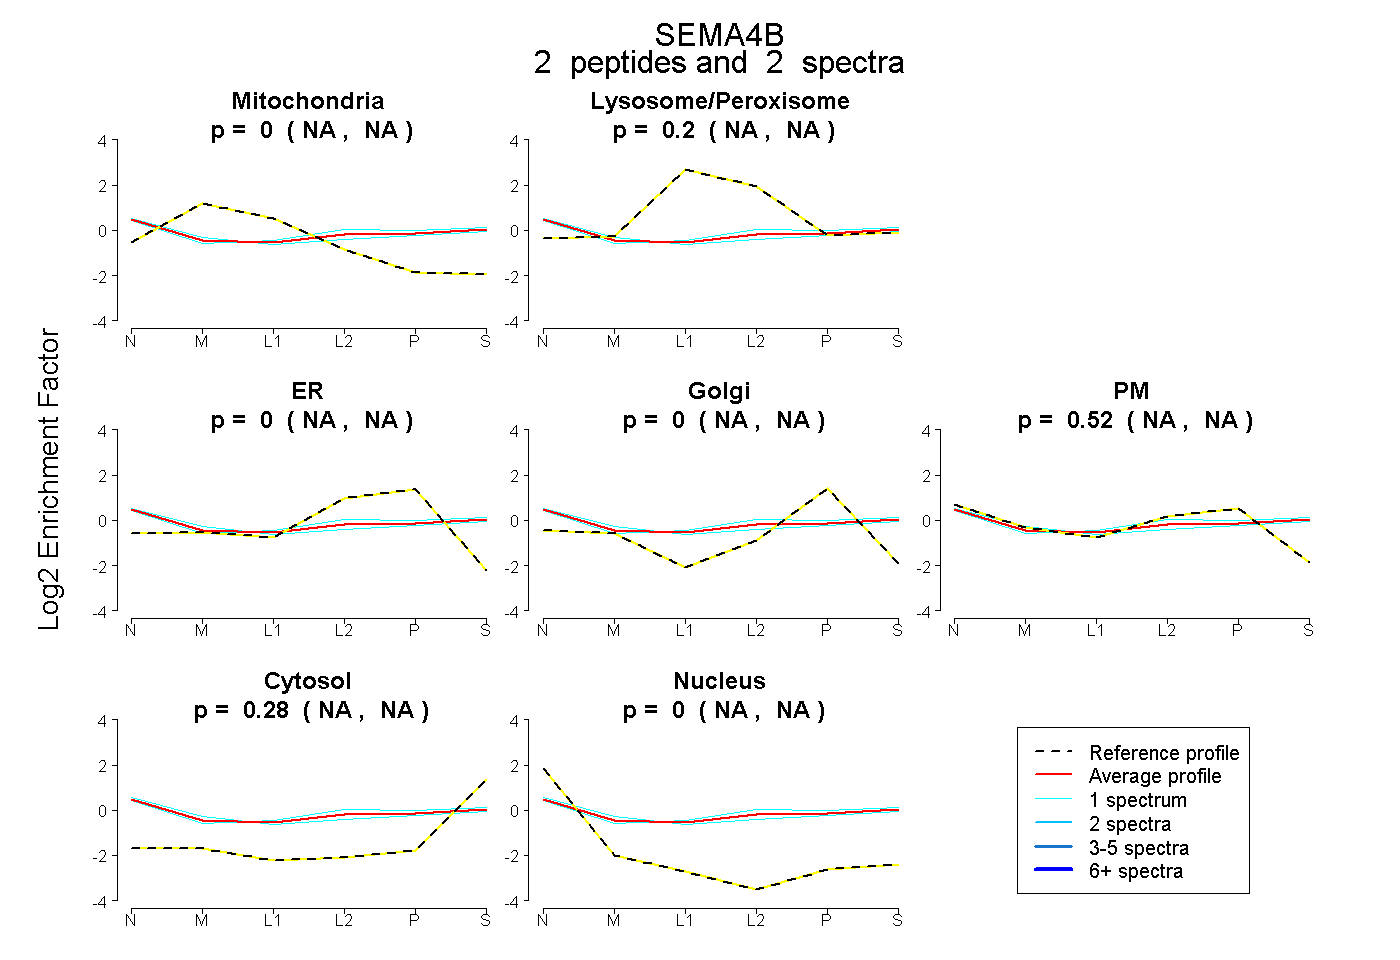
NA | NA
NA | NA
NA | NA
NA | NA
NA | NA
NA | NA
NA | NA
5peptides
spectra
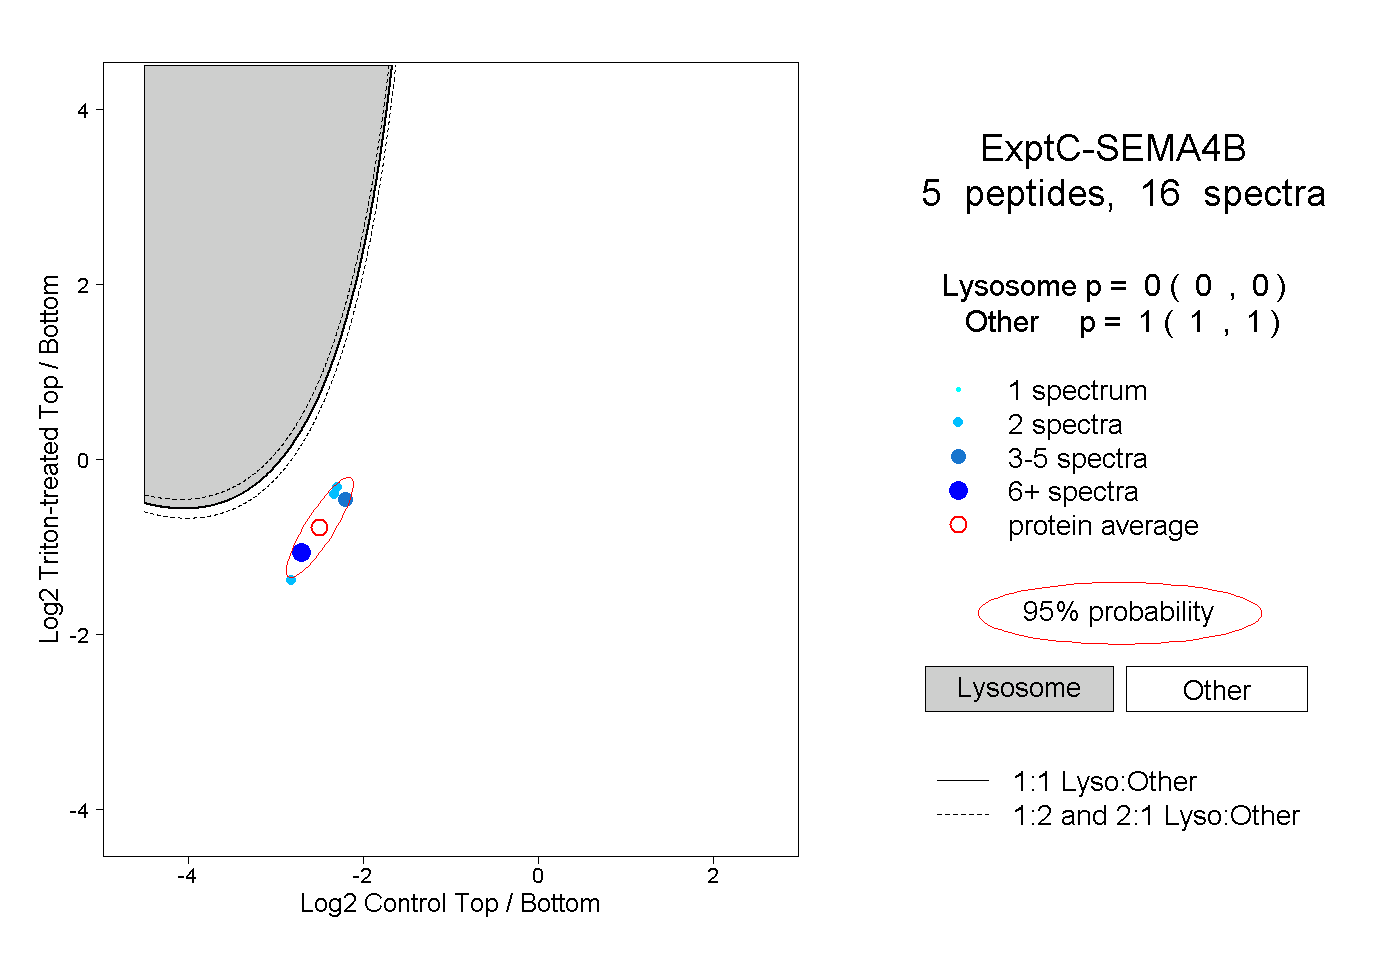
0.000 | 0.000
1.000 | 1.000
1peptide
spectrum
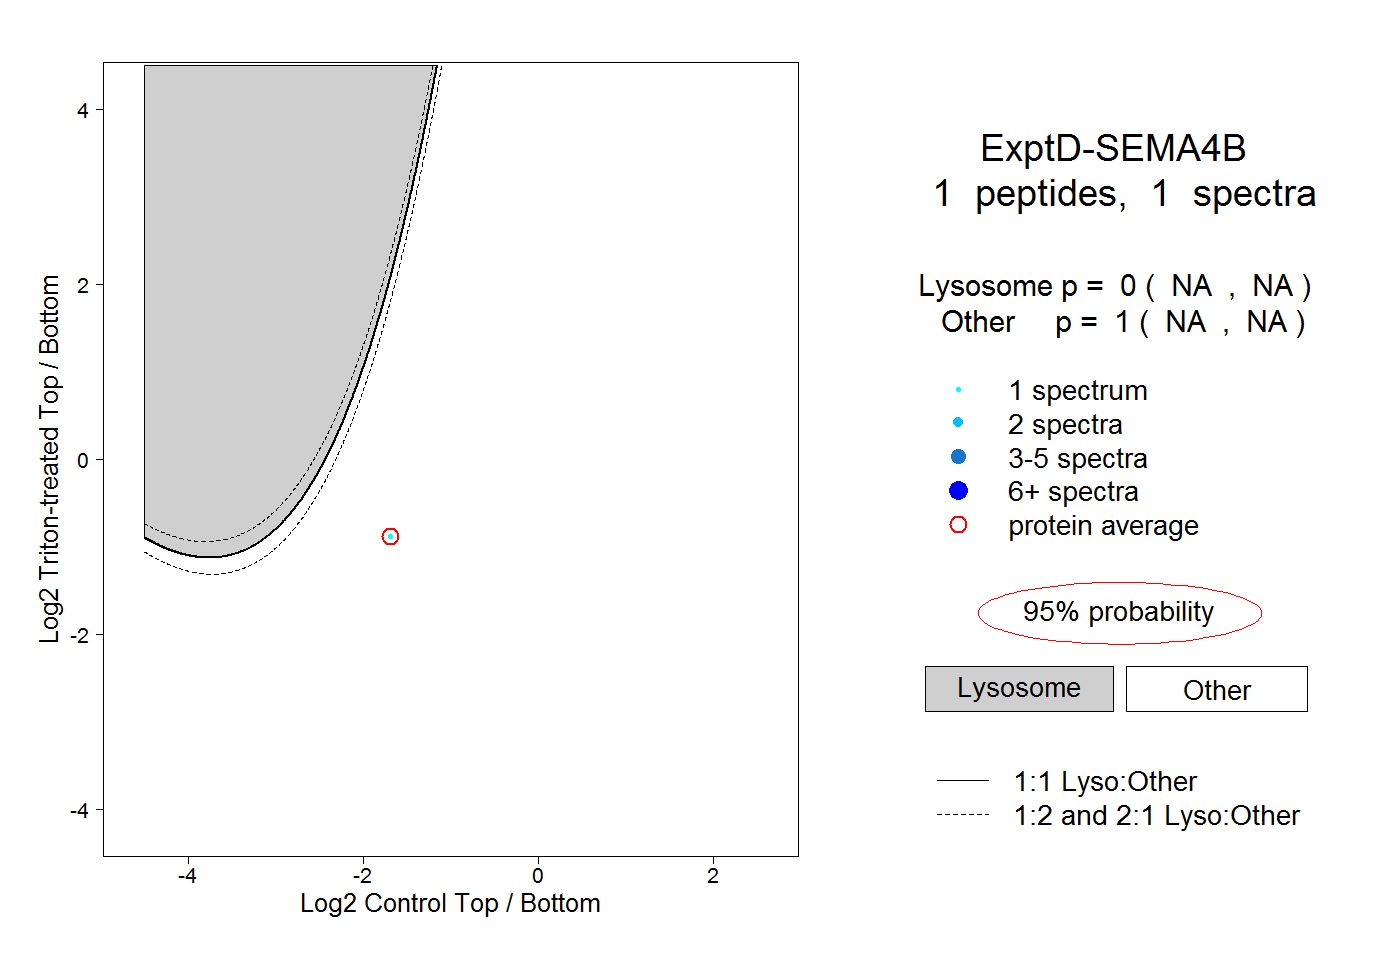
NA | NA
NA | NA