 4
4peptides
spectra
0.000 | 0.000
0.321 | 0.389
0.000 | 0.000
0.000 | 0.000
0.000 | 0.000
0.396 | 0.446
0.202 | 0.233
0.000 | 0.000
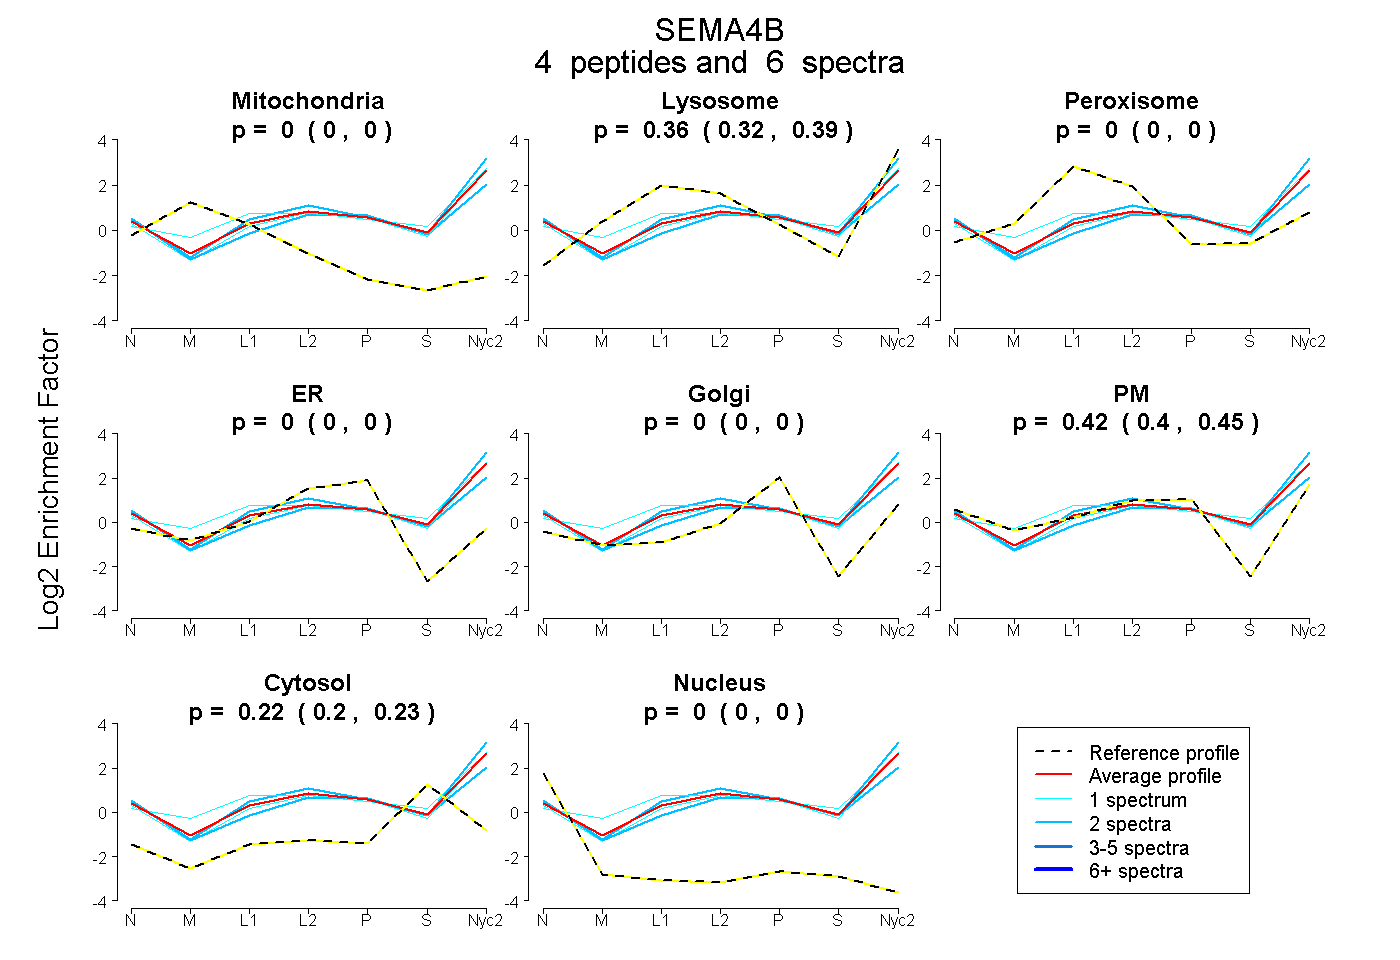
| Plot | Mito | Lyso | Perox | ER | Golgi | PM | Cytosol | Nucleus | |||||
| Expt A |
4 peptides |
6 spectra |
|
0.000 0.000 | 0.000 |
0.359 0.321 | 0.389 |
0.000 0.000 | 0.000 |
0.000 0.000 | 0.000 |
0.000 0.000 | 0.000 |
0.422 0.396 | 0.446 |
0.219 0.202 | 0.233 |
0.000 0.000 | 0.000 |
| 1 spectrum, TLYVGAR | 0.000 | 0.478 | 0.000 | 0.000 | 0.000 | 0.360 | 0.162 | 0.000 | ||
| 2 spectra, ISVPLDSEER | 0.000 | 0.169 | 0.000 | 0.000 | 0.000 | 0.552 | 0.280 | 0.000 | ||
| 1 spectrum, DEAGSVLLEDGK | 0.000 | 0.368 | 0.000 | 0.000 | 0.000 | 0.361 | 0.270 | 0.000 | ||
| 2 spectra, LLLLQPQAR | 0.000 | 0.427 | 0.000 | 0.000 | 0.000 | 0.405 | 0.168 | 0.000 |
| Plot | Mito | Lyso or Perox | ER | Golgi | PM | Cytosol | Nucleus | ||||||
| Expt B |
2 peptides |
2 spectra |
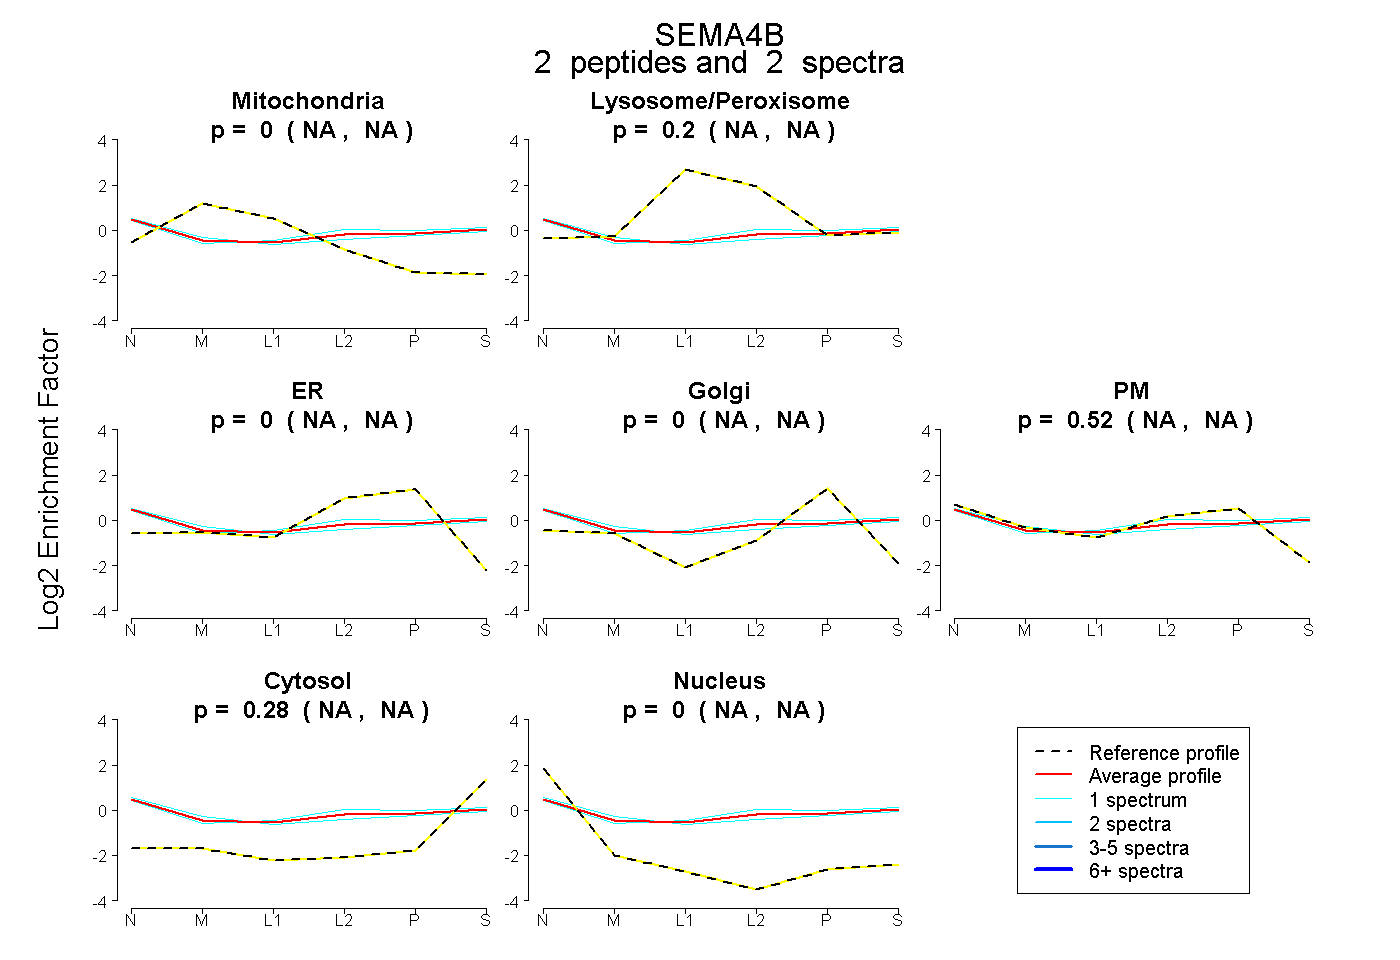 |
0.000 NA | NA |
0.201 NA | NA |
0.000 NA | NA |
0.000 NA | NA |
0.516 NA | NA |
0.283 NA | NA |
0.000 NA | NA |
|||
| Plot | Lyso | Other | |||||||||||
| Expt C |
5 peptides |
16 spectra |
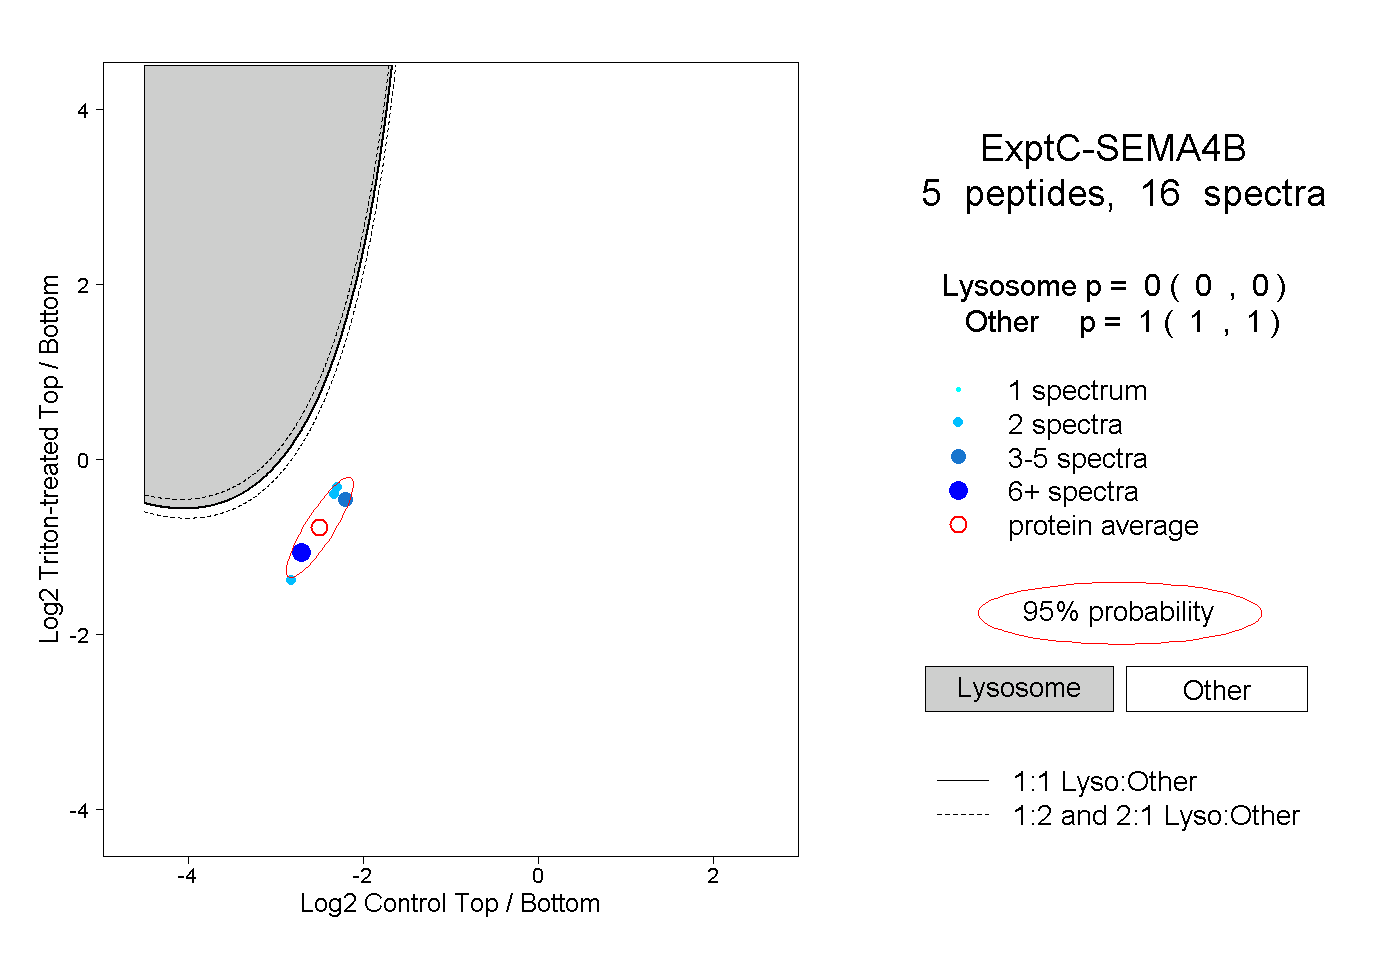 |
0.000 0.000 | 0.000 |
1.000 1.000 | 1.000 |
||||||||
| Plot | Lyso | Other | |||||||||||
| Expt D |
1 peptide |
1 spectrum |
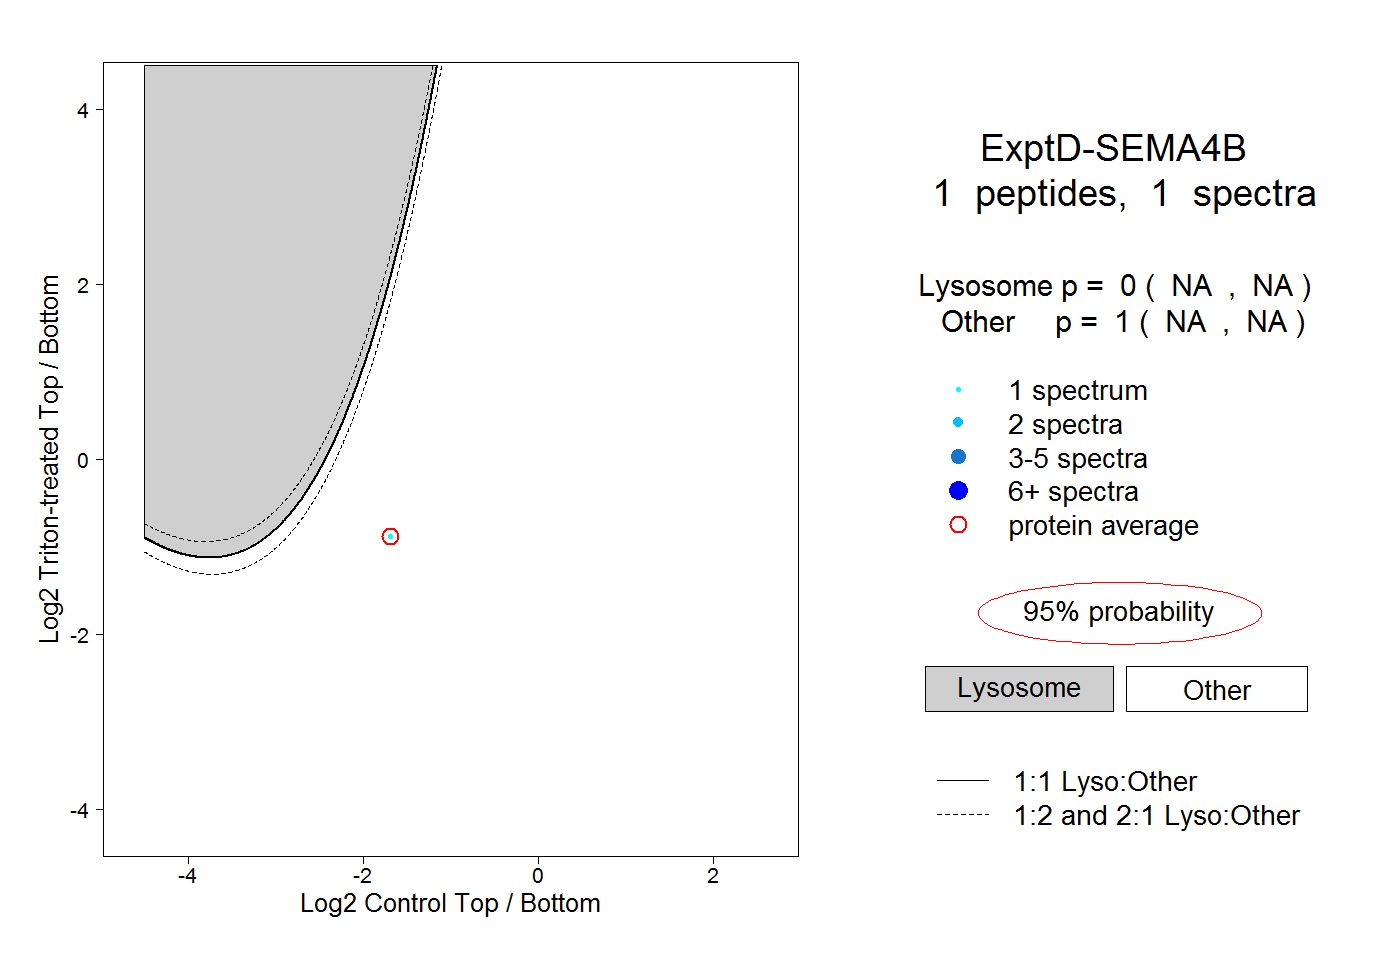 |
0.000 NA | NA |
1.000 NA | NA |