 24
24peptides
spectra
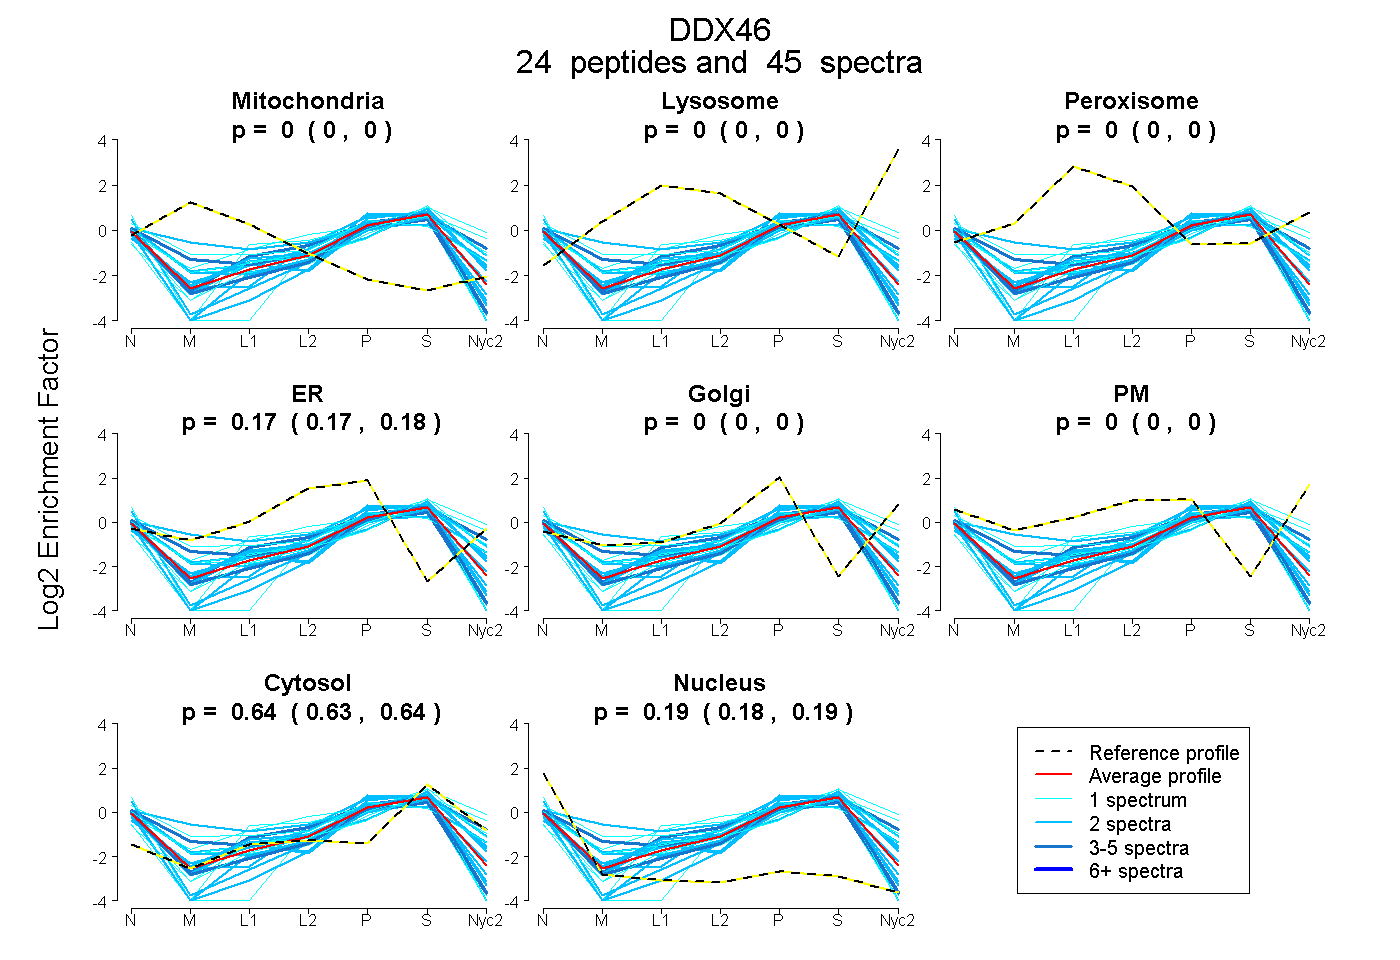
0.000 | 0.000
0.000 | 0.000
0.000 | 0.000
0.170 | 0.178
0.000 | 0.000
0.000 | 0.000
0.631 | 0.639
0.184 | 0.195
4peptides
spectra
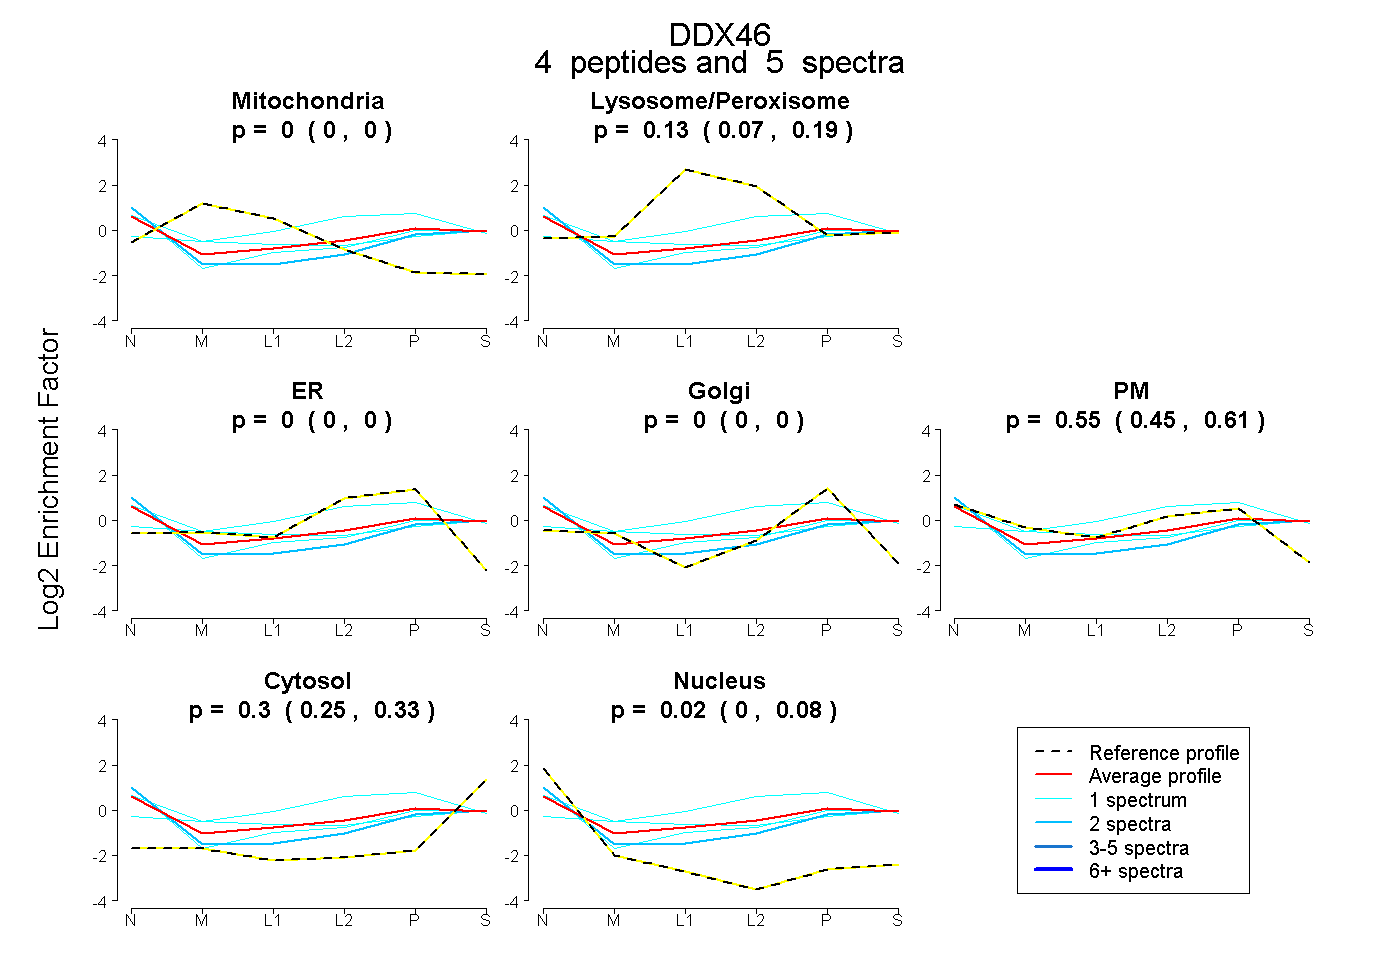
0.000 | 0.000
0.071 | 0.189
0.000 | 0.000
0.000 | 0.000
0.447 | 0.607
0.250 | 0.332
0.000 | 0.081
7peptides
spectra
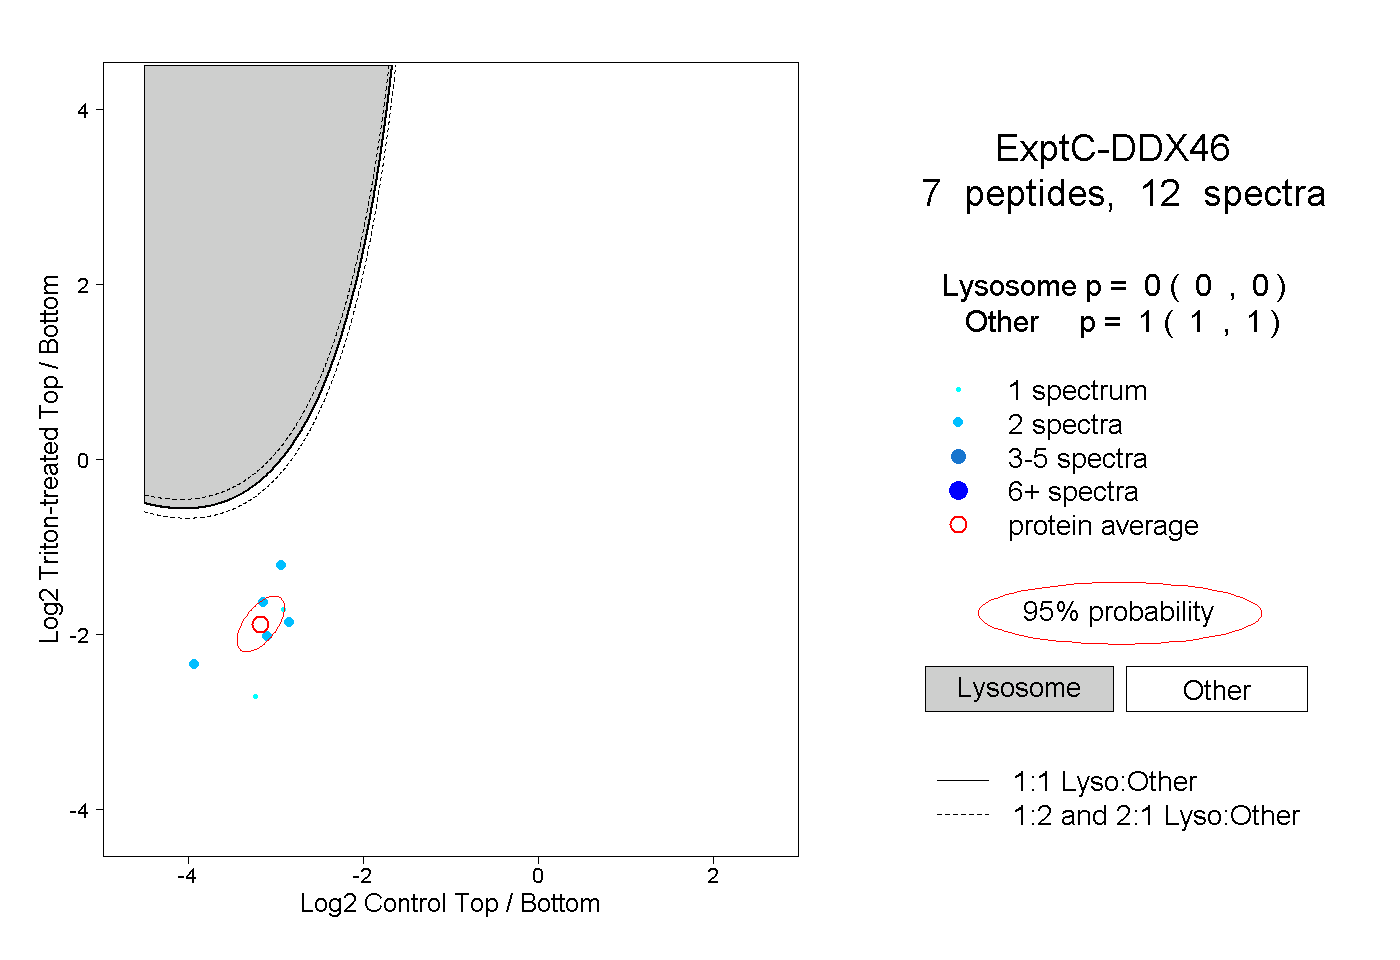
0.000 | 0.000
1.000 | 1.000
2peptides
spectra
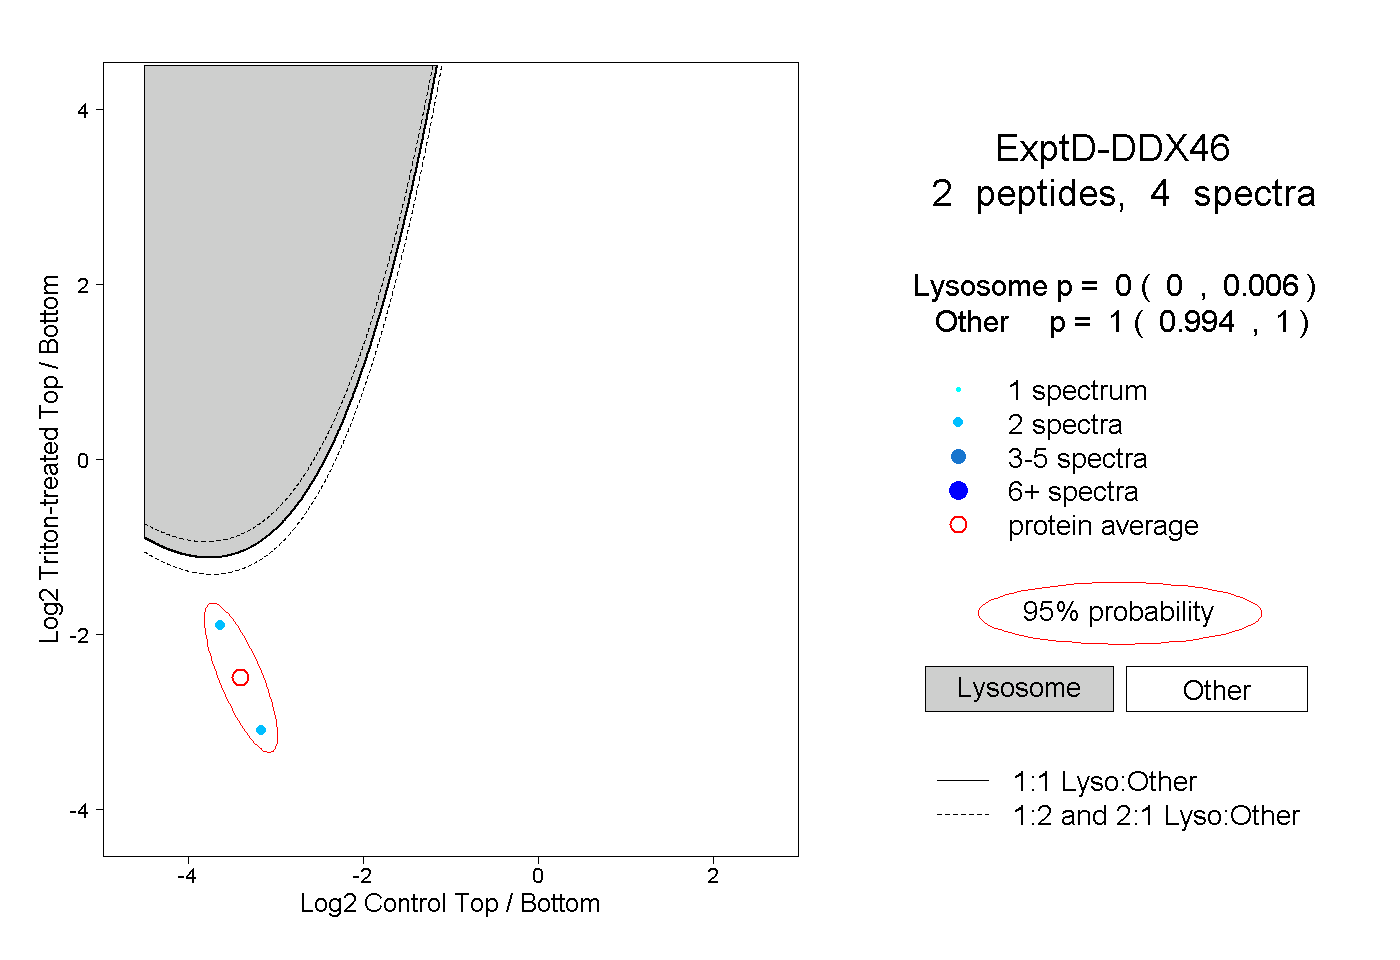
0.000 | 0.006
0.994 | 1.000