 24
24peptides
spectra
0.000 | 0.000
0.000 | 0.000
0.000 | 0.000
0.170 | 0.178
0.000 | 0.000
0.000 | 0.000
0.631 | 0.639
0.184 | 0.195
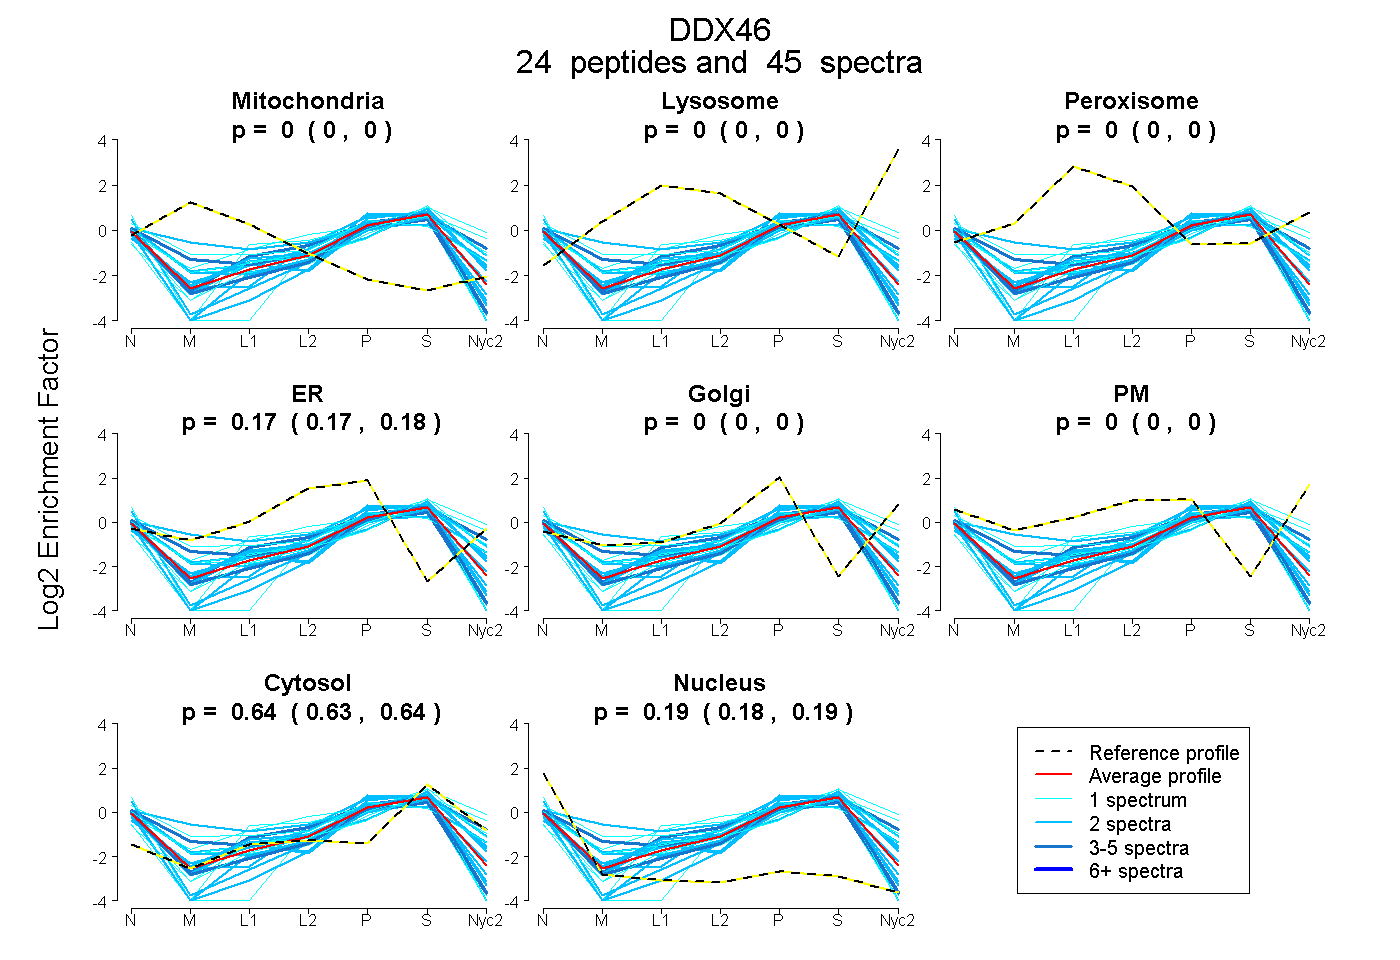
| Plot | Mito | Lyso | Perox | ER | Golgi | PM | Cytosol | Nucleus | |||||
| Expt A |
24 peptides |
45 spectra |
|
0.000 0.000 | 0.000 |
0.000 0.000 | 0.000 |
0.000 0.000 | 0.000 |
0.174 0.170 | 0.178 |
0.000 0.000 | 0.000 |
0.000 0.000 | 0.000 |
0.636 0.631 | 0.639 |
0.190 0.184 | 0.195 |
| 1 spectrum, SLEEGEGPIAVIMTPTR | 0.000 | 0.000 | 0.000 | 0.088 | 0.000 | 0.000 | 0.623 | 0.289 | ||
| 1 spectrum, LEEEMR | 0.000 | 0.000 | 0.025 | 0.156 | 0.000 | 0.183 | 0.636 | 0.000 | ||
| 1 spectrum, IEYEPFR | 0.000 | 0.000 | 0.000 | 0.098 | 0.000 | 0.000 | 0.602 | 0.300 | ||
| 1 spectrum, SSGFSGK | 0.052 | 0.000 | 0.000 | 0.270 | 0.096 | 0.000 | 0.485 | 0.098 | ||
| 4 spectra, GAEIIVCTPGR | 0.000 | 0.000 | 0.000 | 0.159 | 0.141 | 0.000 | 0.668 | 0.032 | ||
| 2 spectra, IVDNVRPDR | 0.000 | 0.000 | 0.000 | 0.199 | 0.000 | 0.000 | 0.585 | 0.216 | ||
| 2 spectra, DSIINDFK | 0.000 | 0.000 | 0.000 | 0.195 | 0.000 | 0.000 | 0.584 | 0.221 | ||
| 3 spectra, VTYVVLDEADR | 0.000 | 0.000 | 0.000 | 0.084 | 0.000 | 0.000 | 0.611 | 0.305 | ||
| 2 spectra, LLEPVDHGK | 0.000 | 0.000 | 0.000 | 0.000 | 0.191 | 0.000 | 0.705 | 0.104 | ||
| 1 spectrum, HGYEKPTPIQTQAIPAIMSGR | 0.000 | 0.000 | 0.000 | 0.034 | 0.000 | 0.000 | 0.494 | 0.472 | ||
| 1 spectrum, QTVMFSATFPR | 0.000 | 0.000 | 0.000 | 0.090 | 0.212 | 0.000 | 0.625 | 0.074 | ||
| 2 spectra, LEMEGITVK | 0.000 | 0.000 | 0.000 | 0.086 | 0.000 | 0.000 | 0.614 | 0.299 | ||
| 2 spectra, FDETEQALANER | 0.000 | 0.000 | 0.000 | 0.000 | 0.201 | 0.000 | 0.655 | 0.144 | ||
| 2 spectra, SWVQCGISMK | 0.000 | 0.000 | 0.000 | 0.175 | 0.000 | 0.000 | 0.616 | 0.209 | ||
| 4 spectra, LLVATSVAAR | 0.058 | 0.000 | 0.000 | 0.193 | 0.000 | 0.000 | 0.488 | 0.261 | ||
| 2 spectra, DLIGIAK | 0.000 | 0.000 | 0.000 | 0.137 | 0.000 | 0.000 | 0.750 | 0.113 | ||
| 1 spectrum, GYAYTFITEDQAR | 0.000 | 0.000 | 0.000 | 0.124 | 0.093 | 0.008 | 0.776 | 0.000 | ||
| 2 spectra, EIEEMK | 0.000 | 0.000 | 0.000 | 0.087 | 0.000 | 0.000 | 0.597 | 0.316 | ||
| 2 spectra, VVTVVTTK | 0.000 | 0.000 | 0.000 | 0.000 | 0.000 | 0.000 | 0.666 | 0.334 | ||
| 2 spectra, NFYVEVPELAK | 0.000 | 0.000 | 0.000 | 0.051 | 0.000 | 0.000 | 0.602 | 0.347 | ||
| 2 spectra, ILSKPIEVQVGGR | 0.000 | 0.000 | 0.000 | 0.274 | 0.000 | 0.000 | 0.559 | 0.167 | ||
| 1 spectrum, YAGDIIK | 0.000 | 0.000 | 0.000 | 0.000 | 0.095 | 0.000 | 0.842 | 0.063 | ||
| 2 spectra, LINSLK | 0.185 | 0.000 | 0.000 | 0.305 | 0.000 | 0.000 | 0.510 | 0.000 | ||
| 2 spectra, MSQEEVNVFR | 0.000 | 0.000 | 0.000 | 0.211 | 0.000 | 0.000 | 0.688 | 0.100 |
| Plot | Mito | Lyso or Perox | ER | Golgi | PM | Cytosol | Nucleus | ||||||
| Expt B |
4 peptides |
5 spectra |
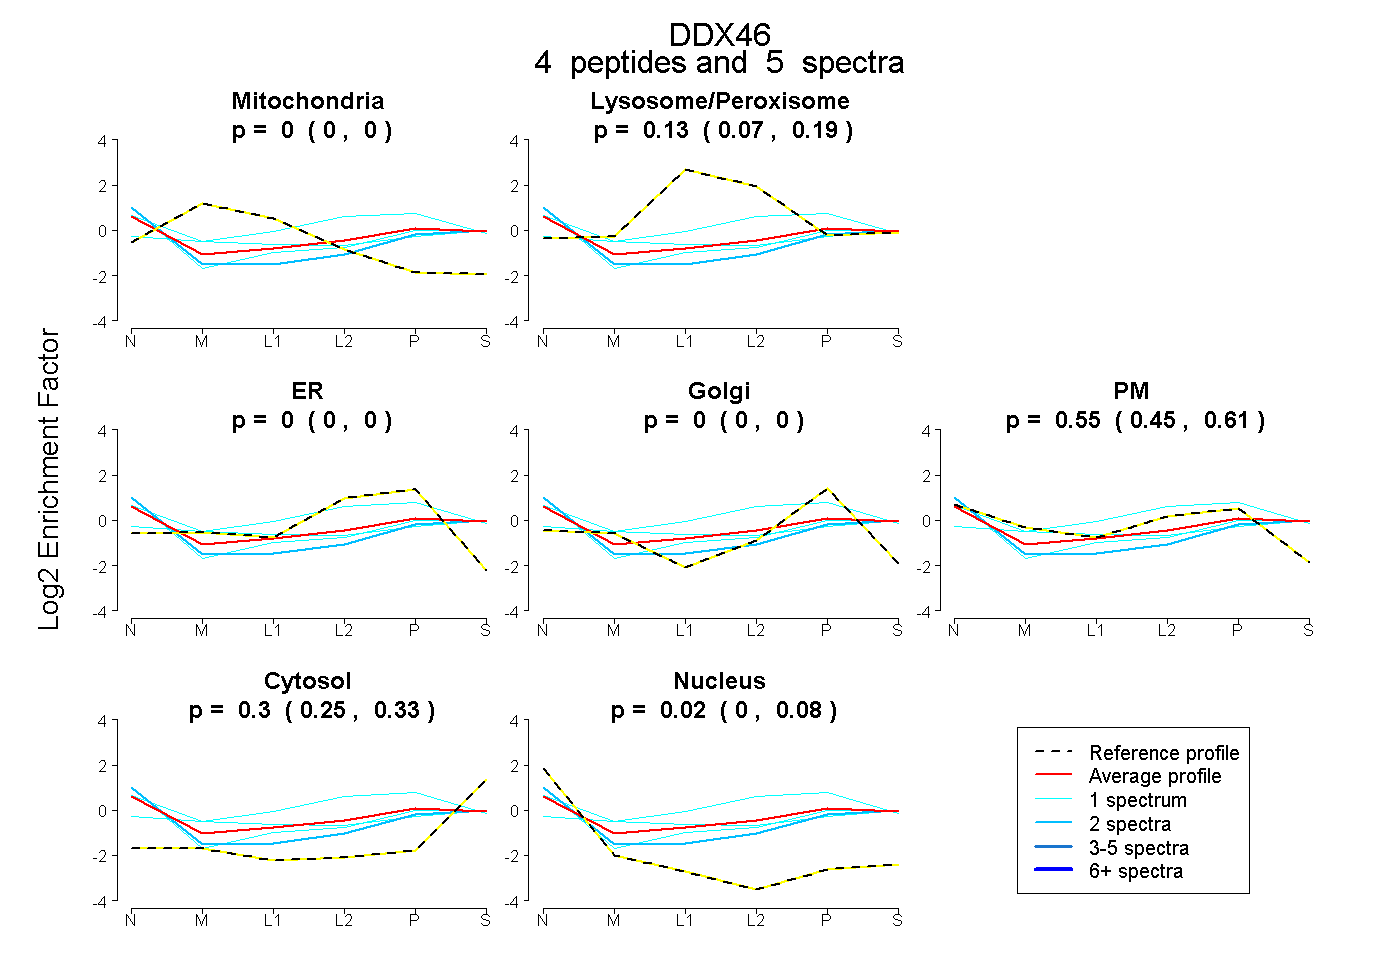 |
0.000 0.000 | 0.000 |
0.129 0.071 | 0.189 |
0.000 0.000 | 0.000 |
0.000 0.000 | 0.000 |
0.548 0.447 | 0.607 |
0.299 0.250 | 0.332 |
0.024 0.000 | 0.081 |
|||
| Plot | Lyso | Other | |||||||||||
| Expt C |
7 peptides |
12 spectra |
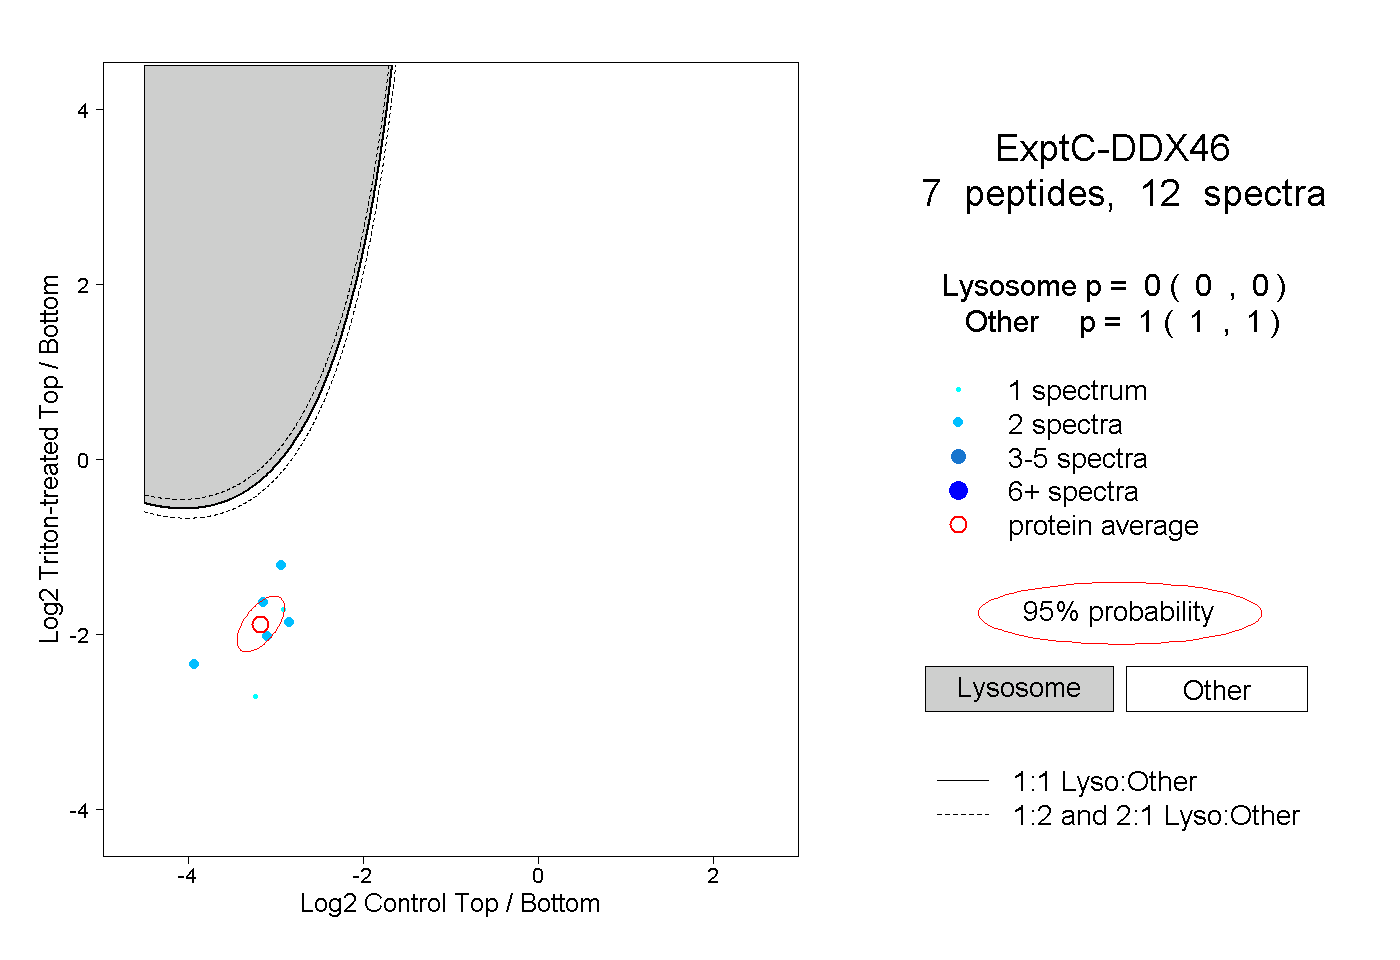 |
0.000 0.000 | 0.000 |
1.000 1.000 | 1.000 |
||||||||
| Plot | Lyso | Other | |||||||||||
| Expt D |
2 peptides |
4 spectra |
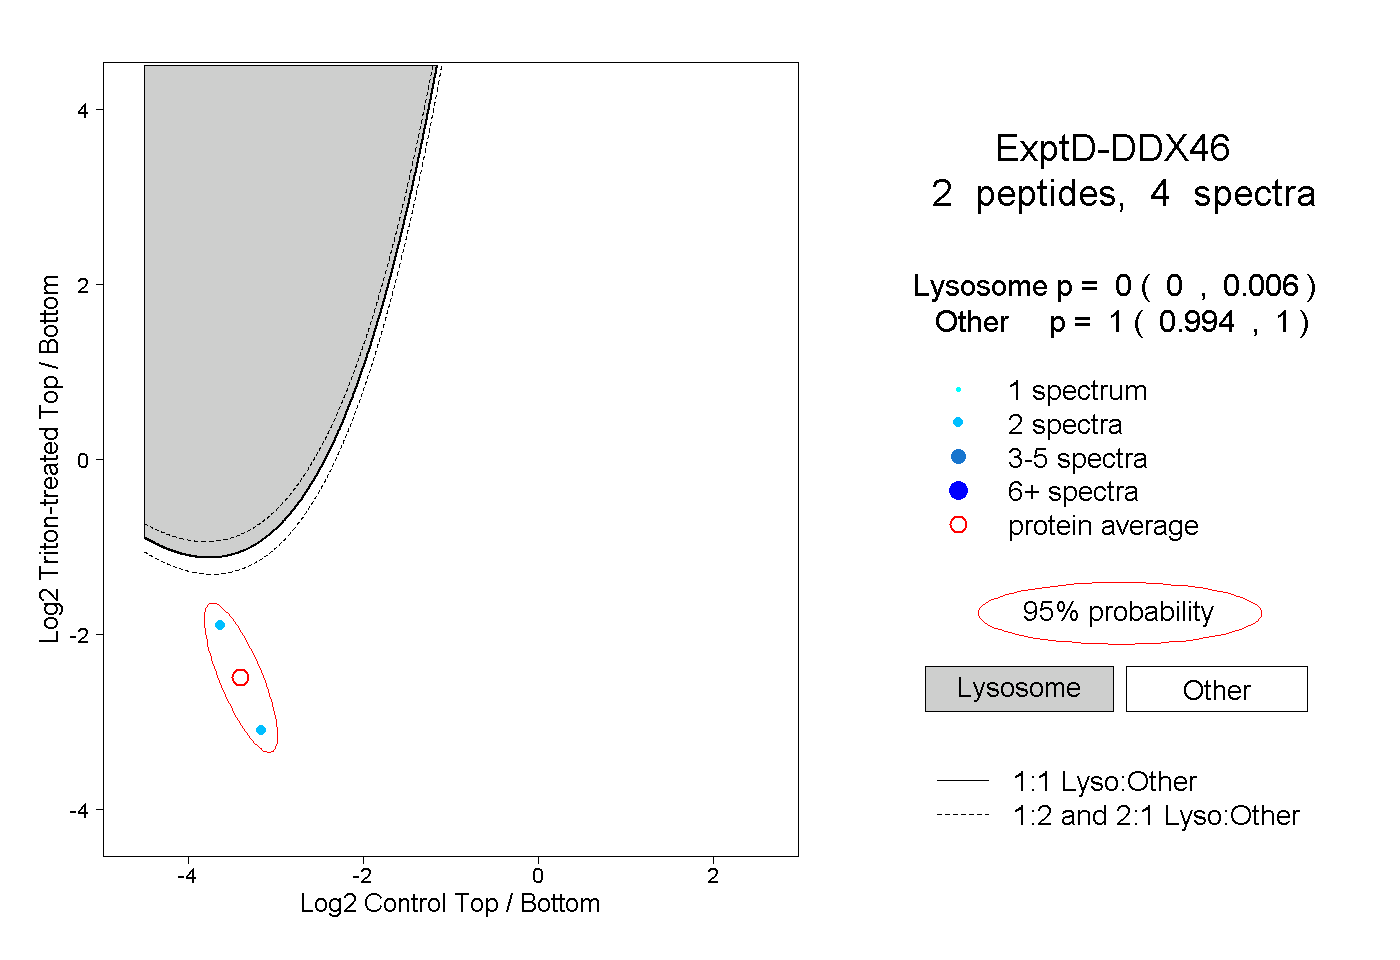 |
0.000 0.000 | 0.006 |
1.000 0.994 | 1.000 |