 26
26peptides
spectra
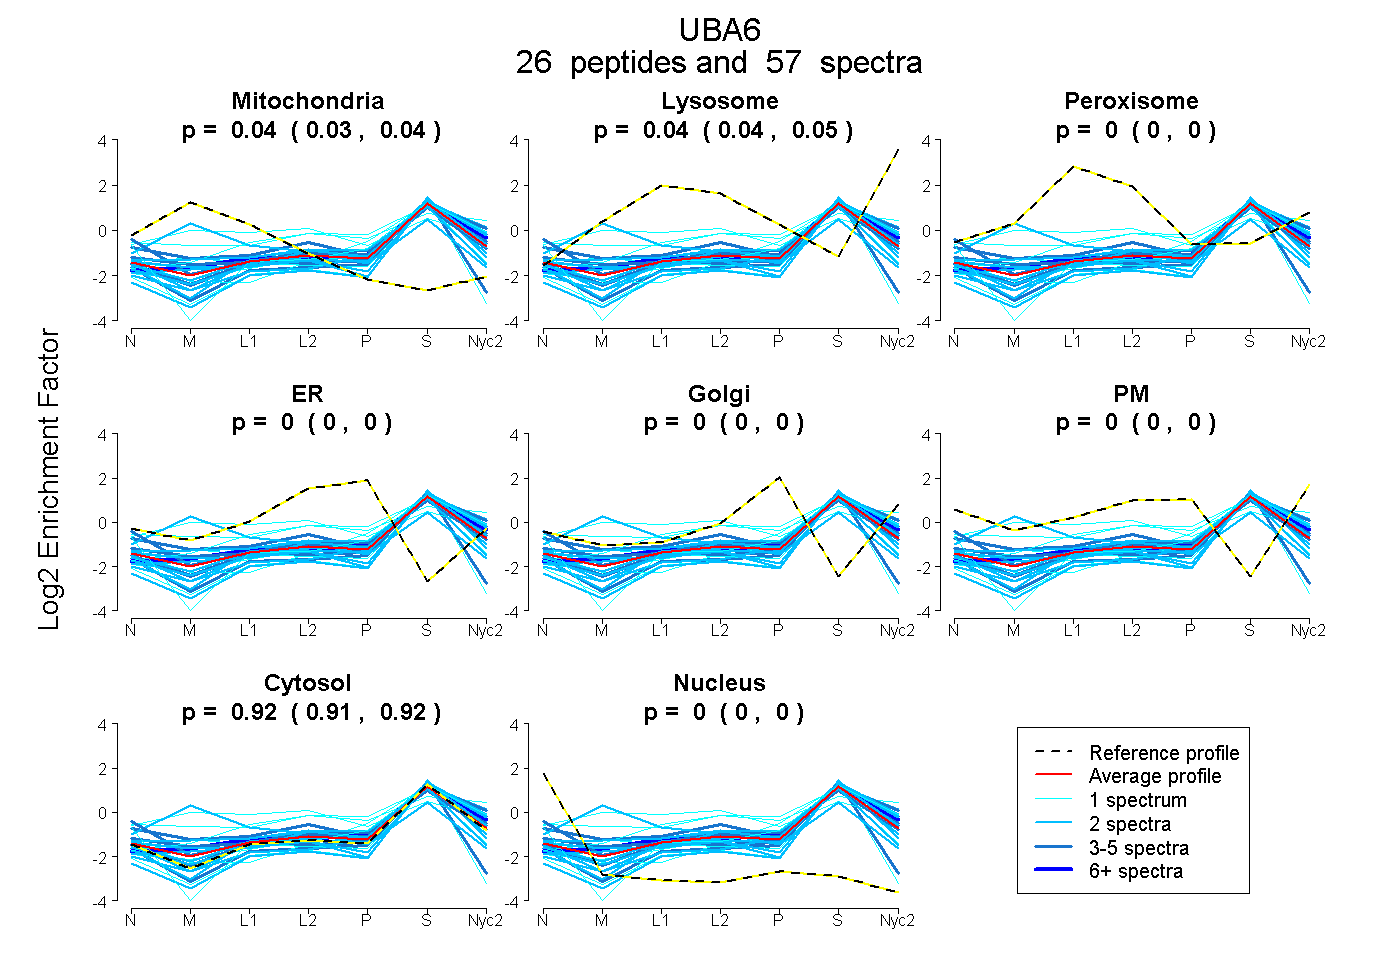
0.033 | 0.045
0.037 | 0.048
0.000 | 0.000
0.000 | 0.000
0.000 | 0.004
0.000 | 0.000
0.911 | 0.921
0.000 | 0.000
4peptides
spectra
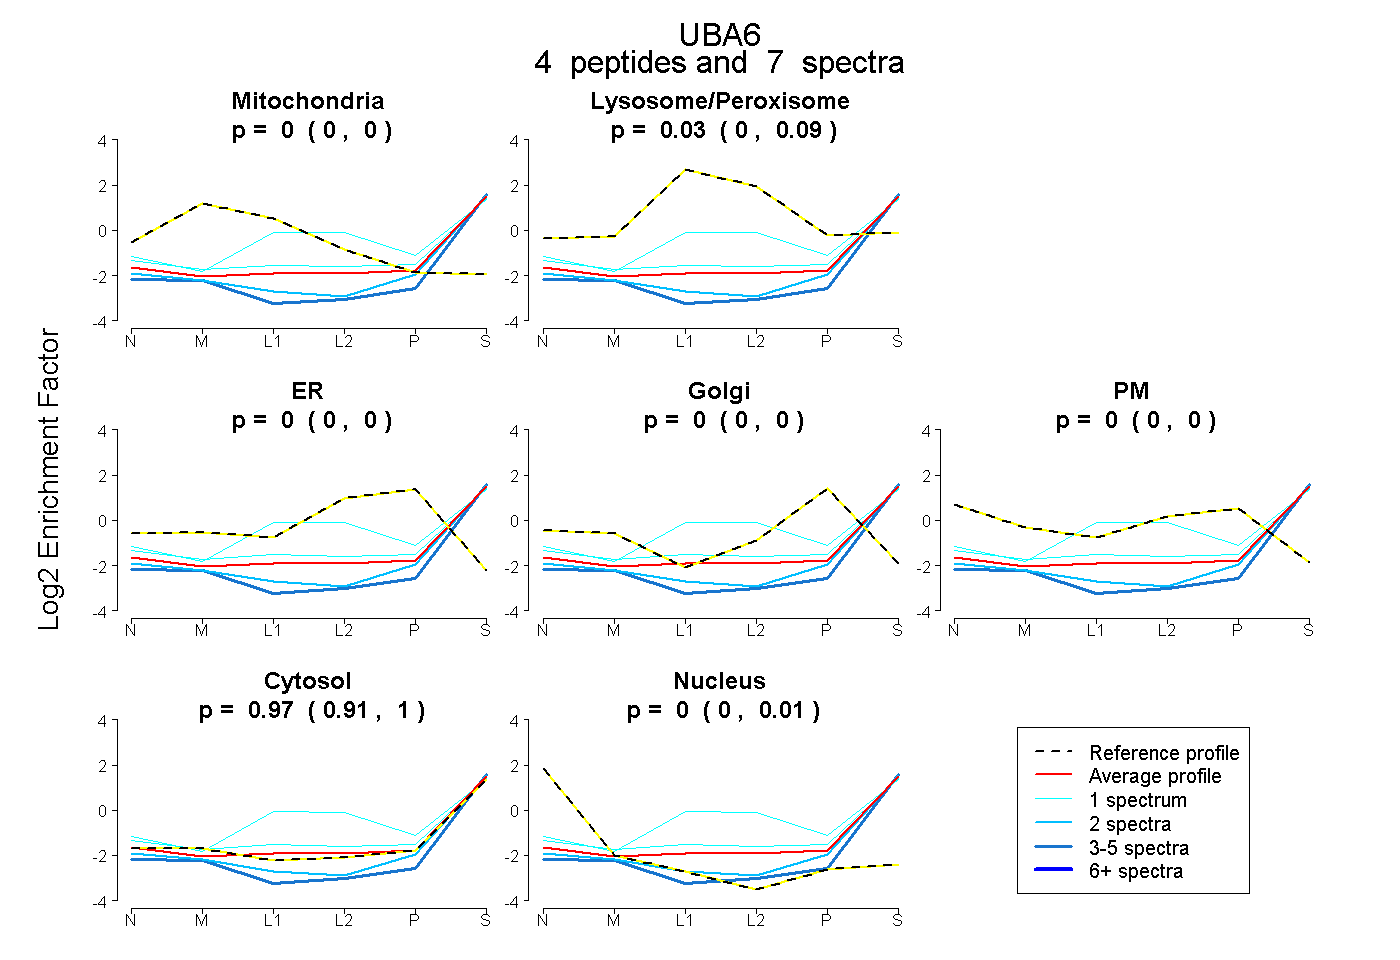
0.000 | 0.000
0.000 | 0.088
0.000 | 0.000
0.000 | 0.000
0.000 | 0.000
0.905 | 1.000
0.000 | 0.011
12peptides
spectra
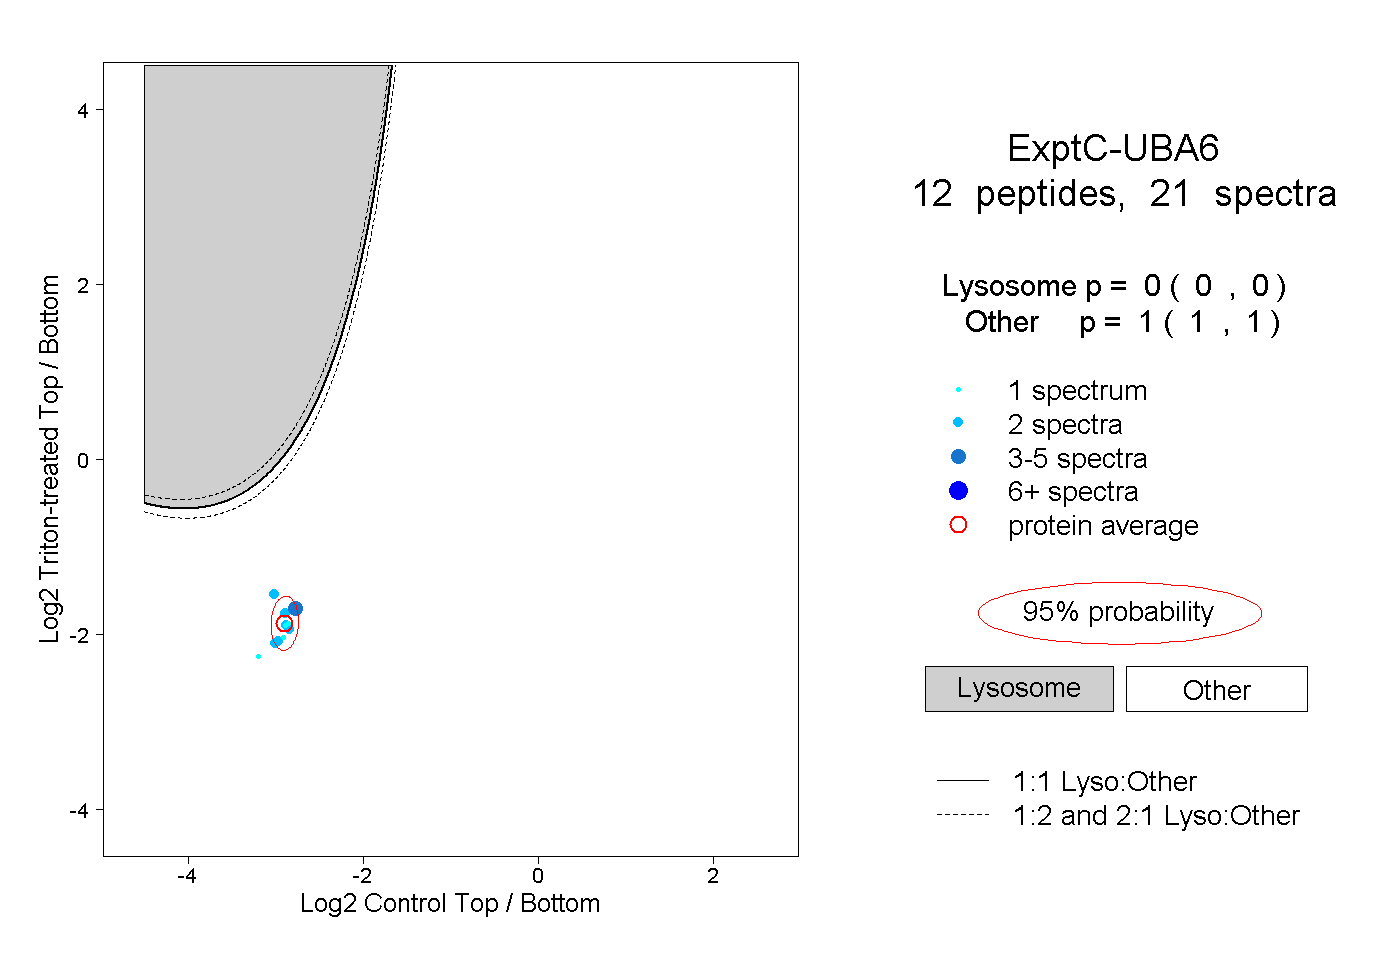
0.000 | 0.000
1.000 | 1.000