 26
26peptides
spectra
0.033 | 0.045
0.037 | 0.048
0.000 | 0.000
0.000 | 0.000
0.000 | 0.004
0.000 | 0.000
0.911 | 0.921
0.000 | 0.000
| Plot | Mito | Lyso | Perox | ER | Golgi | PM | Cytosol | Nucleus | |||||
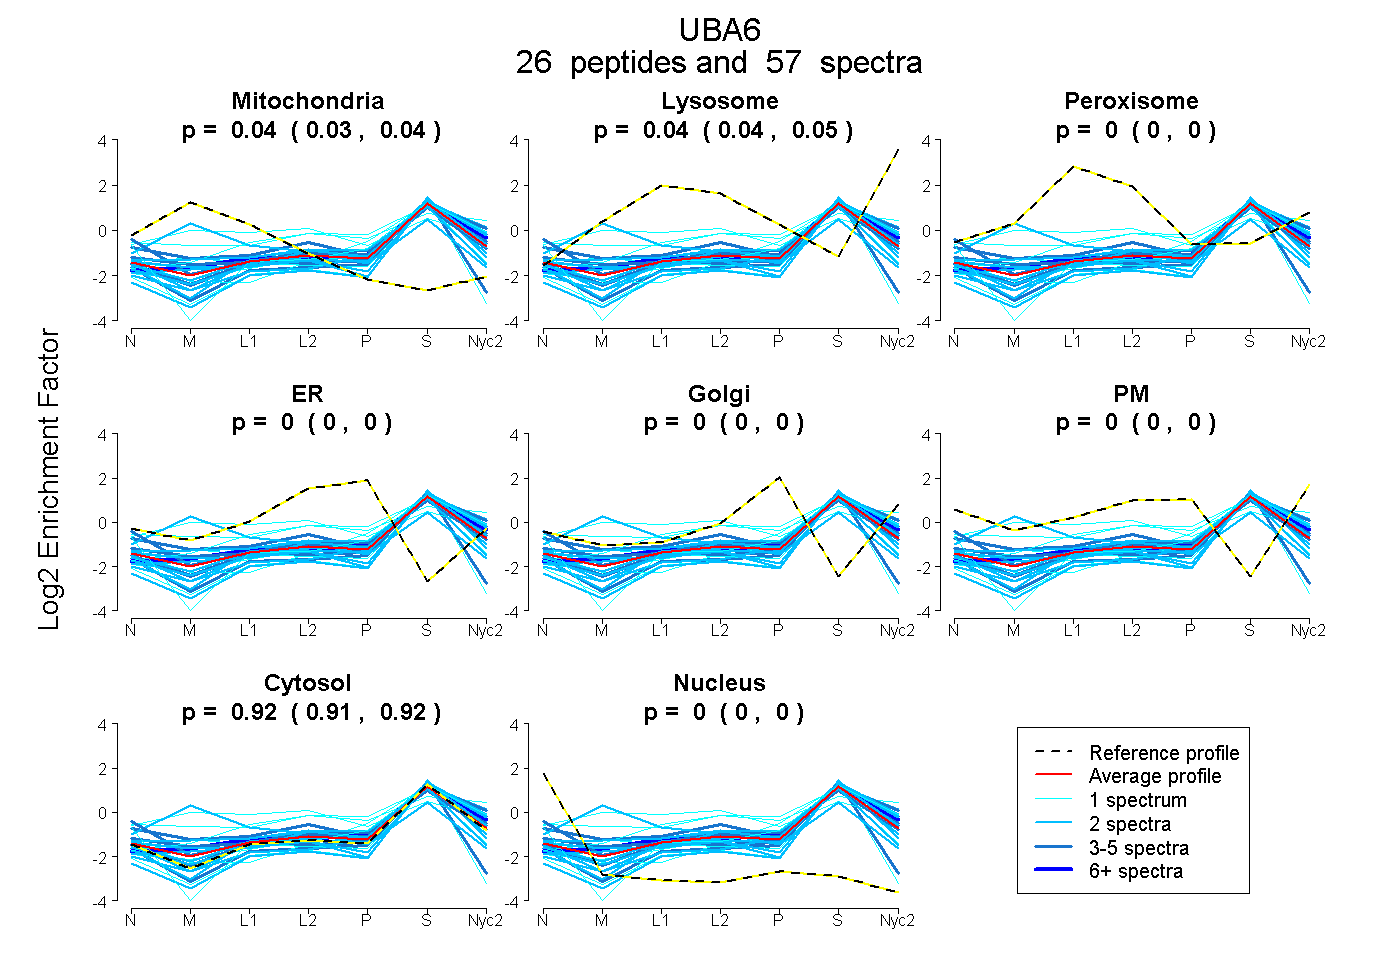
| Expt A |
26 peptides |
57 spectra |
|
0.039 0.033 | 0.045 |
0.044 0.037 | 0.048 |
0.000 0.000 | 0.000 |
0.000 0.000 | 0.000 |
0.000 0.000 | 0.004 |
0.000 0.000 | 0.000 |
0.917 0.911 | 0.921 |
0.000 0.000 | 0.000 |
| 2 spectra, VVQTDETAR | 0.000 | 0.010 | 0.000 | 0.000 | 0.017 | 0.000 | 0.973 | 0.000 | ||
| 2 spectra, RPPSPIK | 0.000 | 0.049 | 0.000 | 0.000 | 0.000 | 0.000 | 0.951 | 0.000 | ||
| 2 spectra, EDFTLSDFINAVK | 0.000 | 0.000 | 0.000 | 0.000 | 0.000 | 0.000 | 0.991 | 0.009 | ||
| 7 spectra, MLYVPVMPGHAK | 0.018 | 0.111 | 0.000 | 0.000 | 0.000 | 0.000 | 0.871 | 0.000 | ||
| 2 spectra, SFPAAVEHTIQWAR | 0.000 | 0.056 | 0.000 | 0.000 | 0.000 | 0.000 | 0.944 | 0.000 | ||
| 1 spectrum, DPPEEEIPFCTLK | 0.000 | 0.000 | 0.000 | 0.000 | 0.110 | 0.000 | 0.890 | 0.000 | ||
| 1 spectrum, DLSVDSLMDILSEVK | 0.136 | 0.014 | 0.331 | 0.000 | 0.025 | 0.048 | 0.446 | 0.000 | ||
| 4 spectra, IFNFEPLESQIK | 0.000 | 0.076 | 0.000 | 0.000 | 0.000 | 0.000 | 0.924 | 0.000 | ||
| 2 spectra, CQQDSDELLK | 0.000 | 0.042 | 0.000 | 0.000 | 0.000 | 0.000 | 0.958 | 0.000 | ||
| 2 spectra, IDAHLNK | 0.000 | 0.000 | 0.000 | 0.000 | 0.000 | 0.000 | 1.000 | 0.000 | ||
| 4 spectra, GMVTVTDPDLIEK | 0.000 | 0.027 | 0.000 | 0.000 | 0.000 | 0.000 | 0.973 | 0.000 | ||
| 2 spectra, MWSQCVELAR | 0.427 | 0.000 | 0.053 | 0.000 | 0.000 | 0.000 | 0.519 | 0.000 | ||
| 1 spectrum, IQNGQSLEGCFQVIK | 0.000 | 0.120 | 0.094 | 0.000 | 0.000 | 0.213 | 0.574 | 0.000 | ||
| 2 spectra, WTVHGK | 0.054 | 0.033 | 0.000 | 0.015 | 0.019 | 0.000 | 0.878 | 0.000 | ||
| 1 spectrum, ACIGNTLCQK | 0.000 | 0.000 | 0.000 | 0.000 | 0.000 | 0.000 | 0.850 | 0.150 | ||
| 2 spectra, LETGQFLTFR | 0.000 | 0.165 | 0.000 | 0.000 | 0.000 | 0.000 | 0.835 | 0.000 | ||
| 1 spectrum, VAGGYPFDAYK | 0.000 | 0.000 | 0.136 | 0.150 | 0.000 | 0.000 | 0.715 | 0.000 | ||
| 2 spectra, YQCVVLTETK | 0.137 | 0.000 | 0.013 | 0.057 | 0.000 | 0.000 | 0.793 | 0.000 | ||
| 3 spectra, NAVFQLEK | 0.000 | 0.000 | 0.012 | 0.000 | 0.000 | 0.134 | 0.800 | 0.054 | ||
| 3 spectra, ALQLLHCFPLDTR | 0.000 | 0.000 | 0.000 | 0.000 | 0.000 | 0.000 | 0.863 | 0.137 | ||
| 1 spectrum, YVLGDTAMQK | 0.000 | 0.000 | 0.000 | 0.000 | 0.058 | 0.000 | 0.942 | 0.000 | ||
| 1 spectrum, ALSSNK | 0.000 | 0.040 | 0.000 | 0.000 | 0.000 | 0.000 | 0.960 | 0.000 | ||
| 2 spectra, NFALLGVGTGR | 0.010 | 0.060 | 0.000 | 0.000 | 0.000 | 0.000 | 0.931 | 0.000 | ||
| 3 spectra, MYNIEPADR | 0.002 | 0.129 | 0.000 | 0.000 | 0.000 | 0.026 | 0.843 | 0.000 | ||
| 3 spectra, KPDHVPVSSEDER | 0.072 | 0.000 | 0.117 | 0.000 | 0.000 | 0.063 | 0.748 | 0.000 | ||
| 1 spectrum, IQEFKPSNK | 0.148 | 0.001 | 0.000 | 0.000 | 0.000 | 0.000 | 0.850 | 0.000 |
| Plot | Mito | Lyso or Perox | ER | Golgi | PM | Cytosol | Nucleus | ||||||
| Expt B |
4 peptides |
7 spectra |
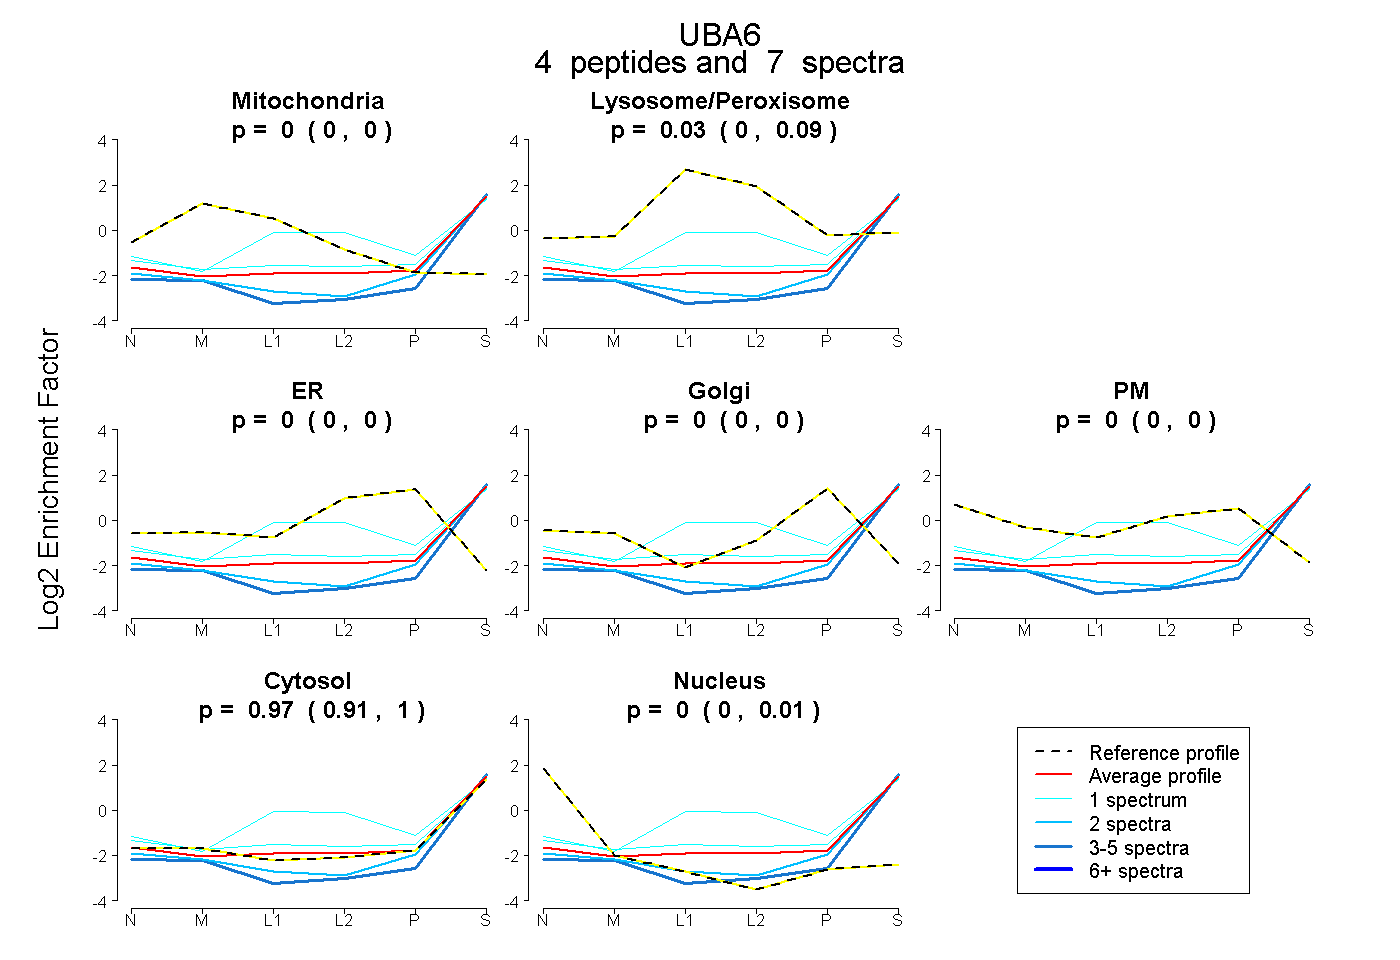 |
0.000 0.000 | 0.000 |
0.031 0.000 | 0.088 |
0.000 0.000 | 0.000 |
0.000 0.000 | 0.000 |
0.000 0.000 | 0.000 |
0.969 0.905 | 1.000 |
0.000 0.000 | 0.011 |
|||
| Plot | Lyso | Other | |||||||||||
| Expt C |
12 peptides |
21 spectra |
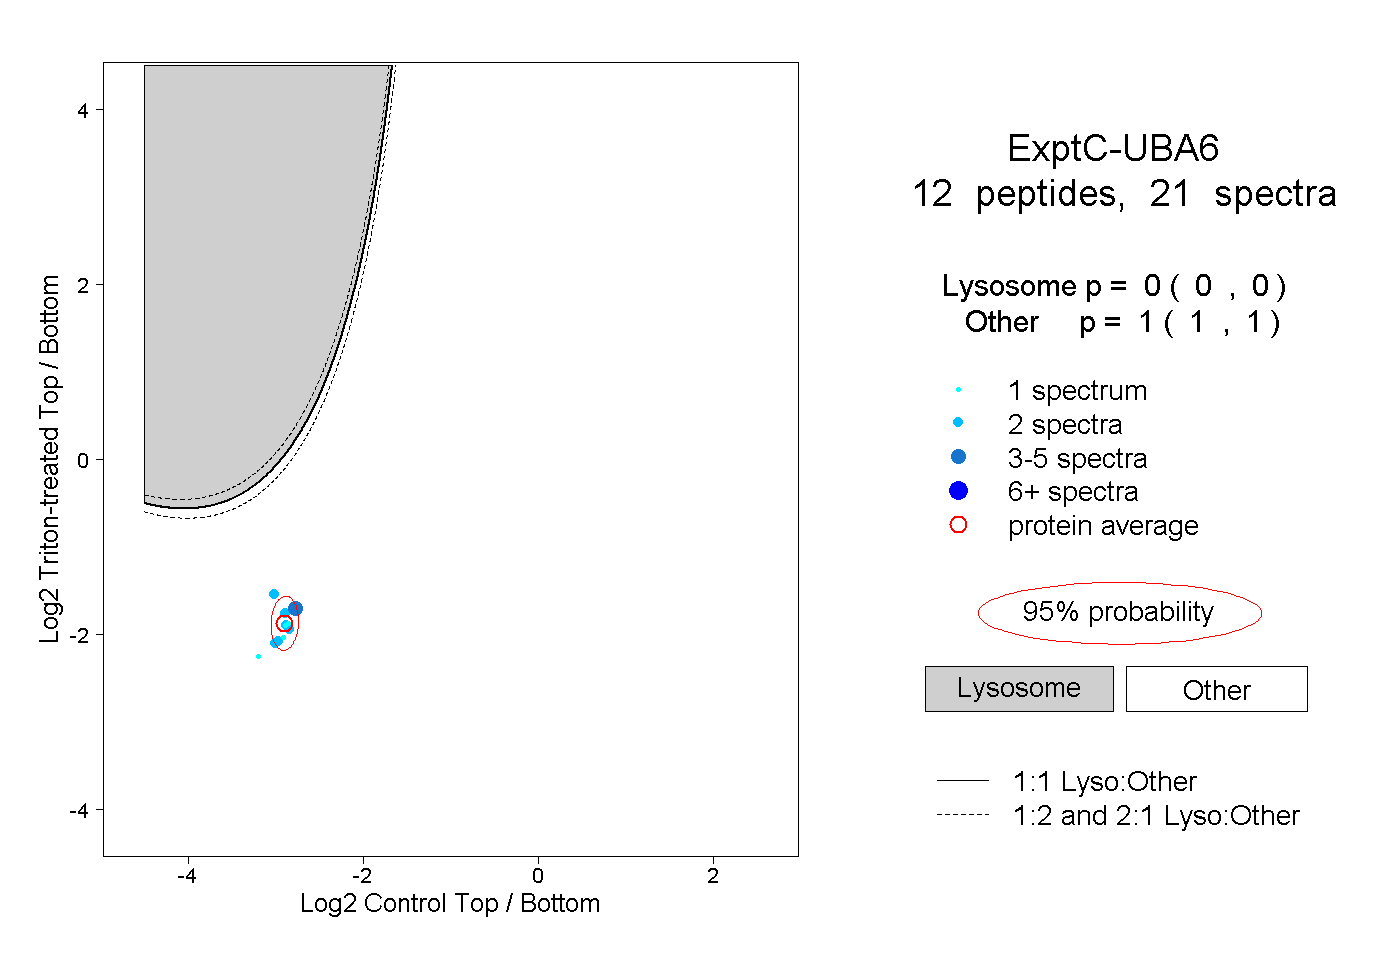 |
0.000 0.000 | 0.000 |
1.000 1.000 | 1.000 |