 6
6peptides
spectra
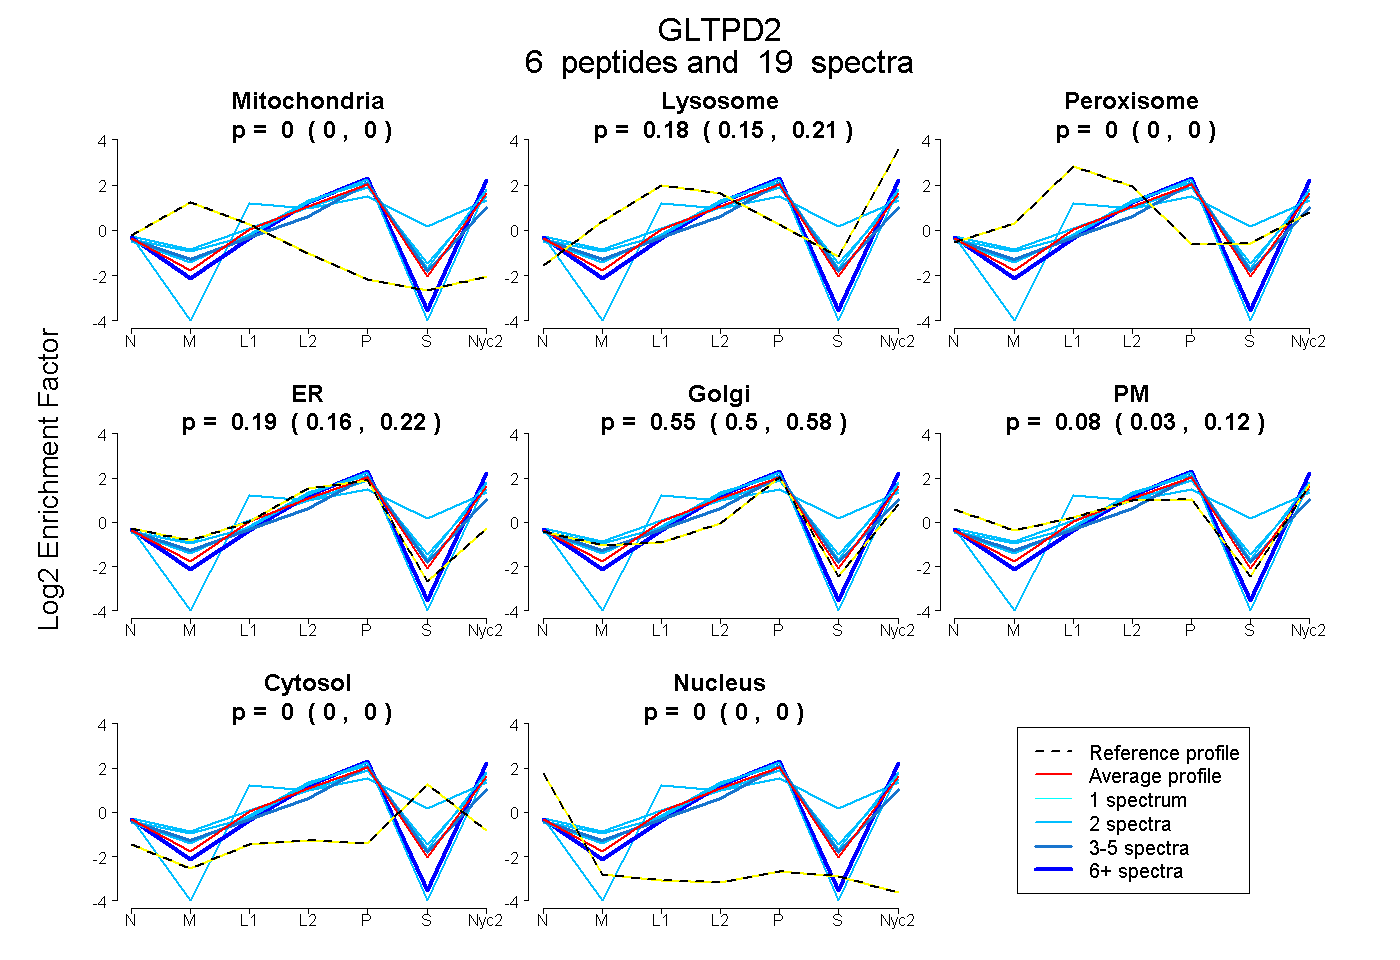
0.000 | 0.000
0.151 | 0.212
0.000 | 0.000
0.158 | 0.225
0.498 | 0.582
0.027 | 0.122
0.000 | 0.005
0.000 | 0.000
2peptides
spectra
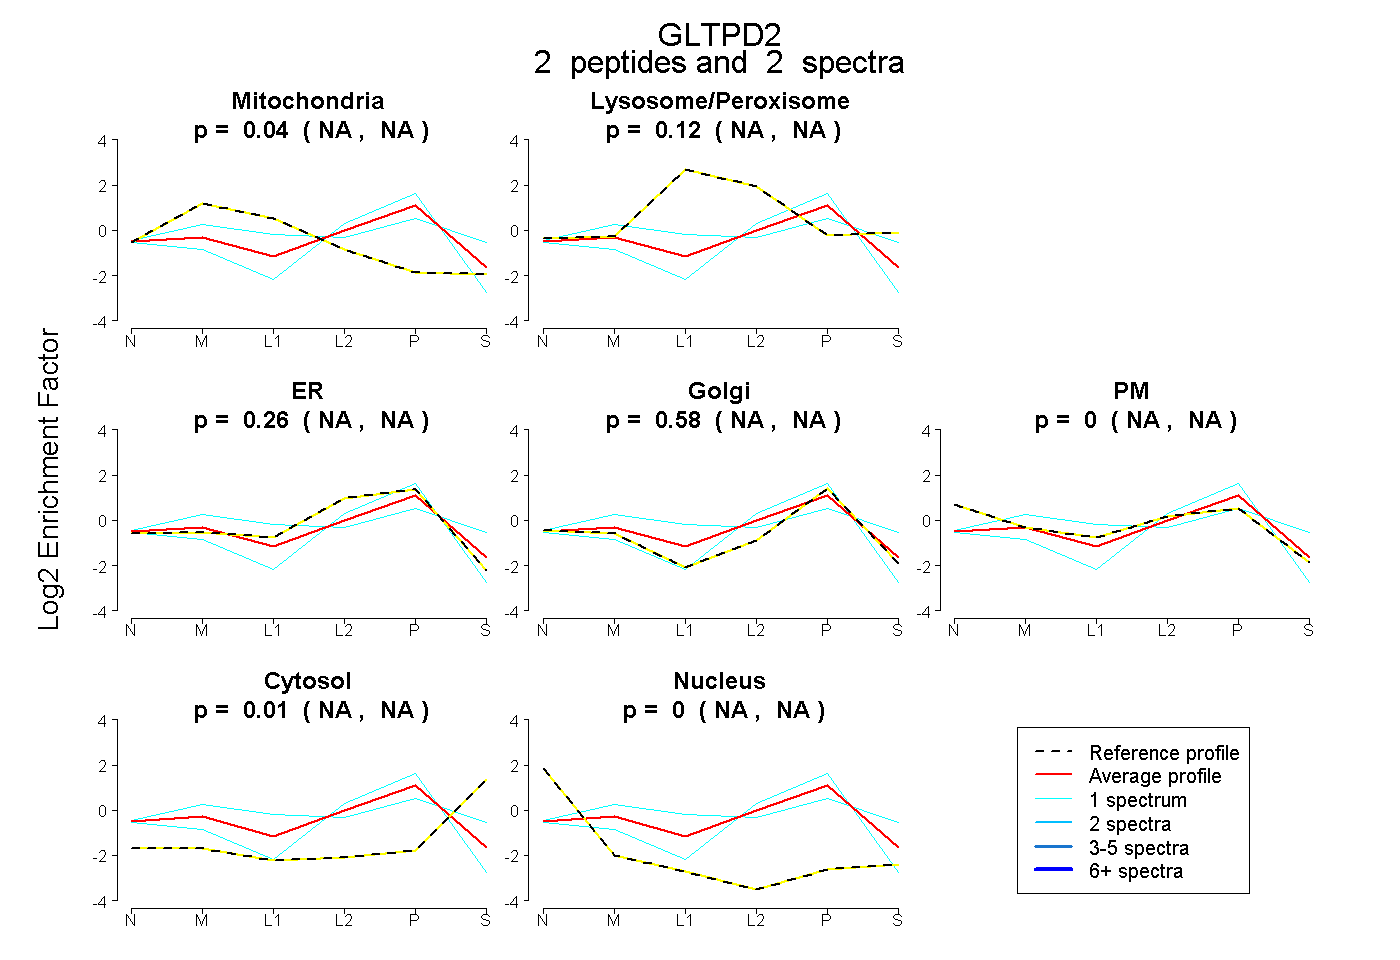
NA | NA
NA | NA
NA | NA
NA | NA
NA | NA
NA | NA
NA | NA
9peptides
spectra
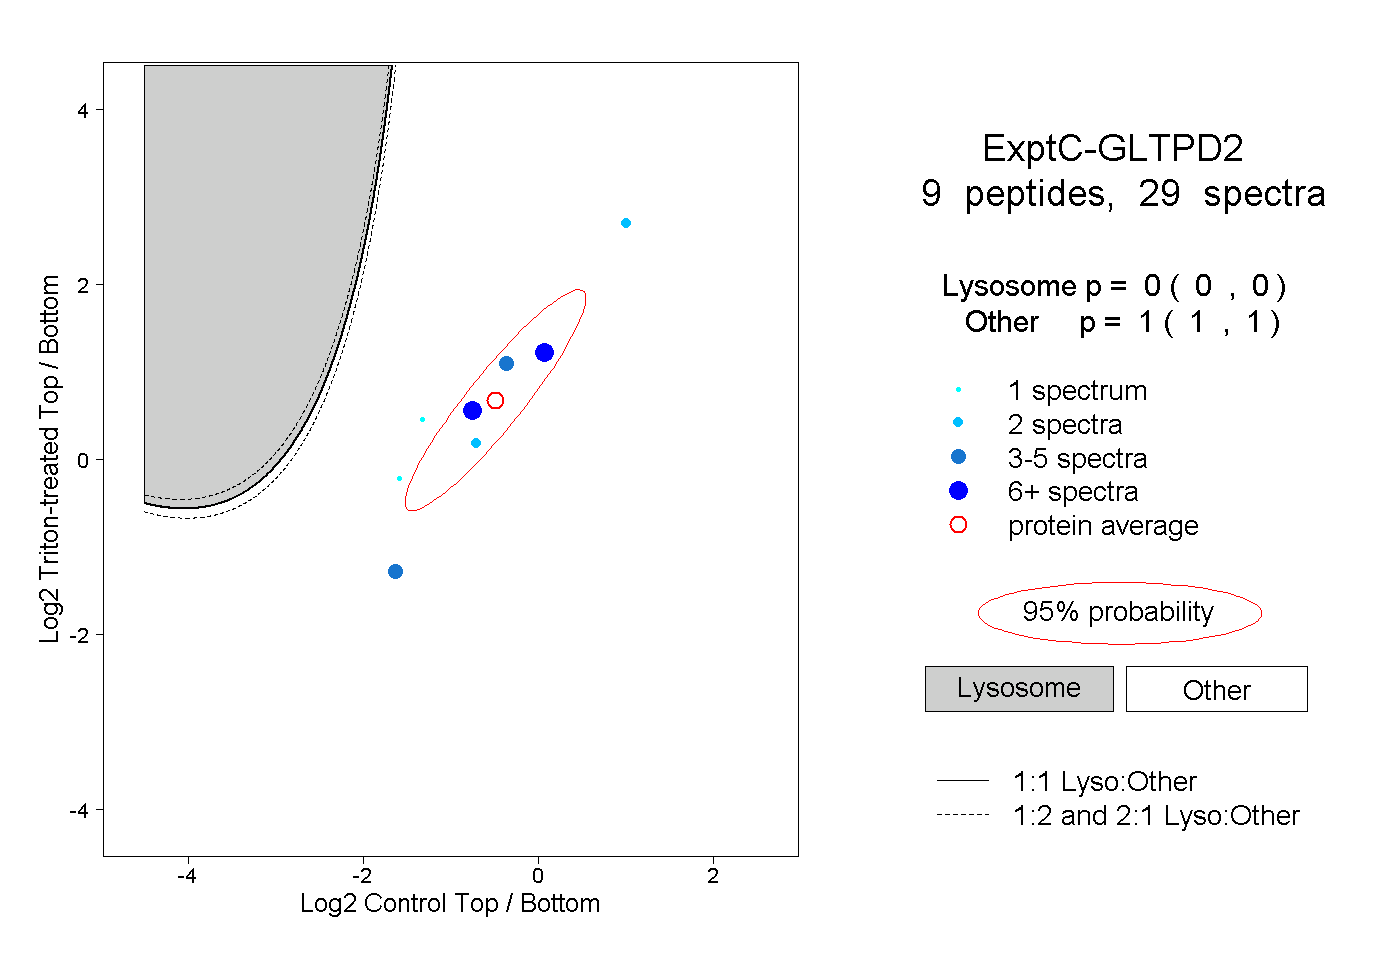
0.000 | 0.000
1.000 | 1.000
2peptides
spectra
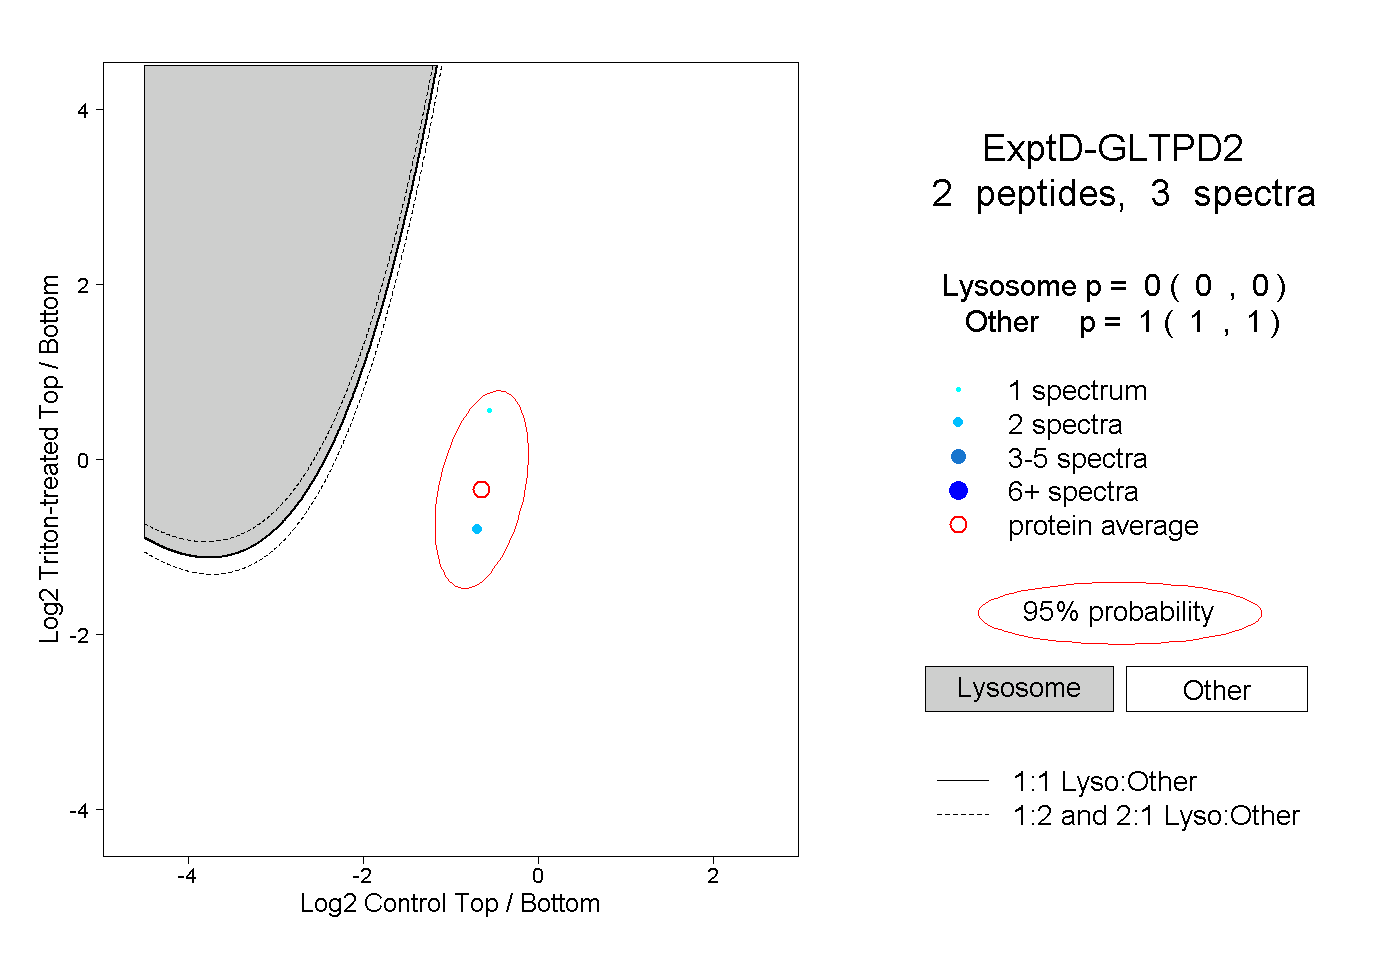
0.000 | 0.000
1.000 | 1.000