 6
6peptides
spectra
0.000 | 0.000
0.151 | 0.212
0.000 | 0.000
0.158 | 0.225
0.498 | 0.582
0.027 | 0.122
0.000 | 0.005
0.000 | 0.000
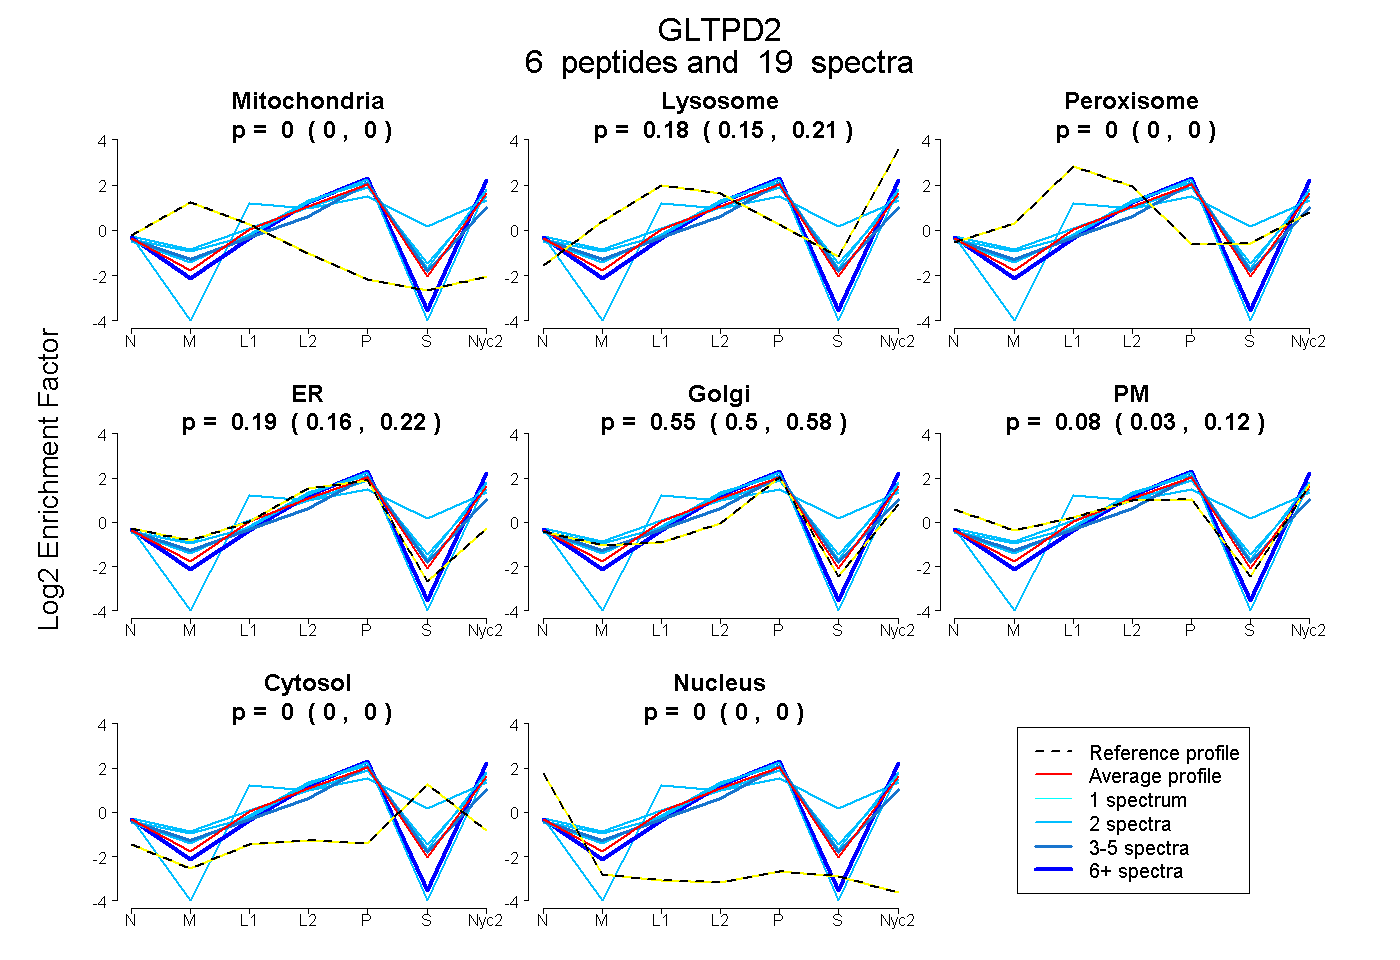
| Plot | Mito | Lyso | Perox | ER | Golgi | PM | Cytosol | Nucleus | |||||
| Expt A |
6 peptides |
19 spectra |
|
0.000 0.000 | 0.000 |
0.185 0.151 | 0.212 |
0.000 0.000 | 0.000 |
0.192 0.158 | 0.225 |
0.548 0.498 | 0.582 |
0.075 0.027 | 0.122 |
0.000 0.000 | 0.005 |
0.000 0.000 | 0.000 |
| 2 spectra, LLQLACPGTGEADAR | 0.000 | 0.261 | 0.000 | 0.188 | 0.551 | 0.000 | 0.000 | 0.000 | ||
| 2 spectra, LGGPEAGAQCR | 0.000 | 0.011 | 0.000 | 0.229 | 0.340 | 0.419 | 0.000 | 0.000 | ||
| 3 spectra, VLGVSLSPALGR | 0.000 | 0.115 | 0.000 | 0.198 | 0.656 | 0.000 | 0.032 | 0.000 | ||
| 2 spectra, DAYSTALAPYHPWLIR | 0.000 | 0.280 | 0.000 | 0.345 | 0.000 | 0.000 | 0.375 | 0.000 | ||
| 8 spectra, LAILTLPSR | 0.000 | 0.018 | 0.000 | 0.041 | 0.567 | 0.375 | 0.000 | 0.000 | ||
| 2 spectra, AVLLERPGTTPR | 0.000 | 0.239 | 0.000 | 0.183 | 0.418 | 0.131 | 0.029 | 0.000 |
| Plot | Mito | Lyso or Perox | ER | Golgi | PM | Cytosol | Nucleus | ||||||
| Expt B |
2 peptides |
2 spectra |
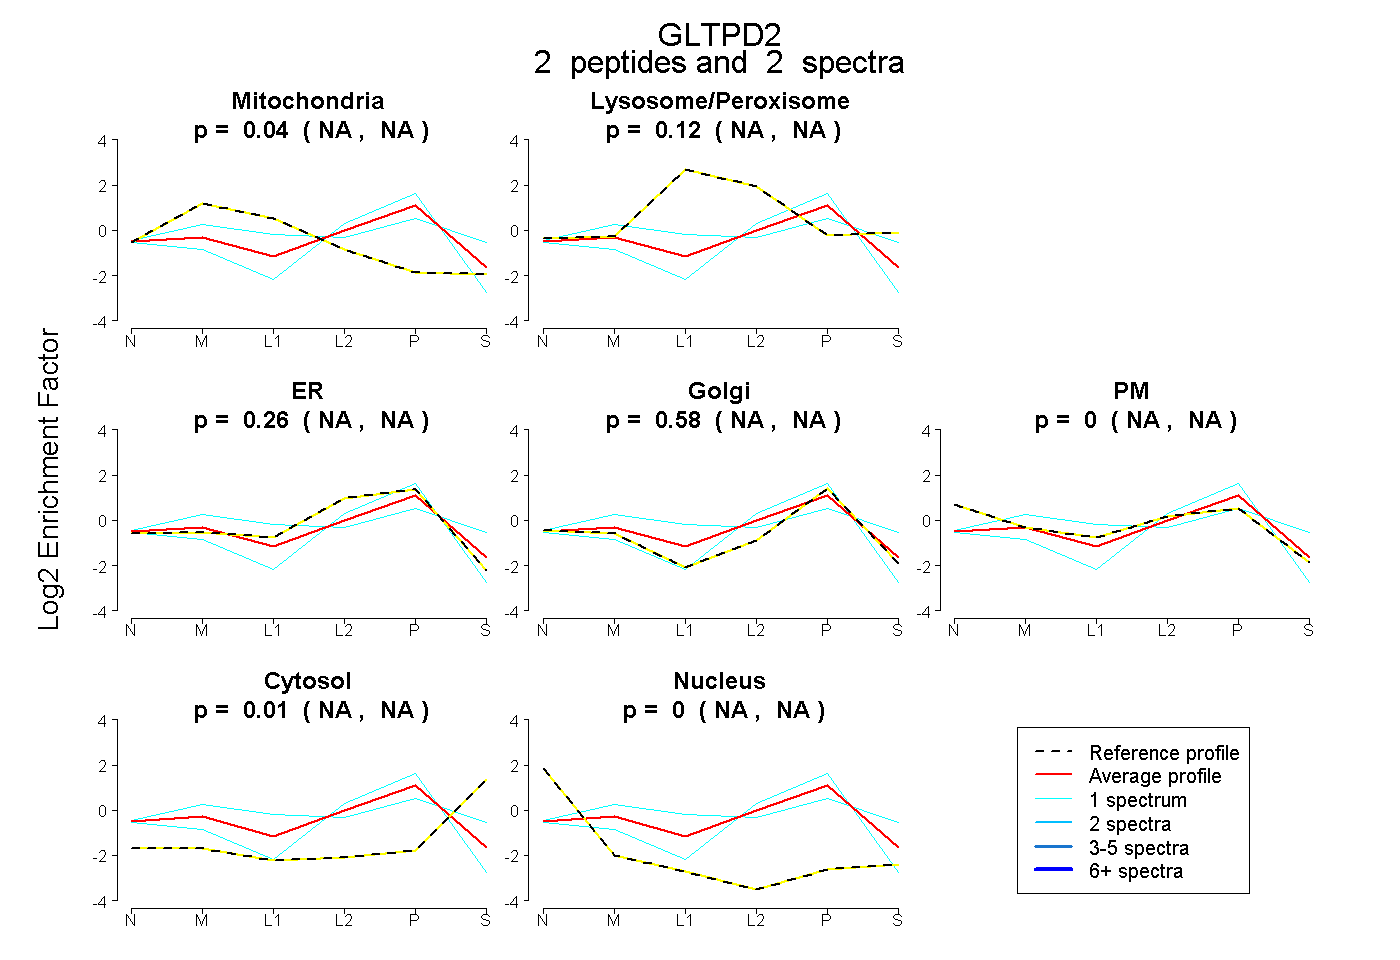 |
0.039 NA | NA |
0.115 NA | NA |
0.261 NA | NA |
0.577 NA | NA |
0.000 NA | NA |
0.007 NA | NA |
0.000 NA | NA |
|||
| Plot | Lyso | Other | |||||||||||
| Expt C |
9 peptides |
29 spectra |
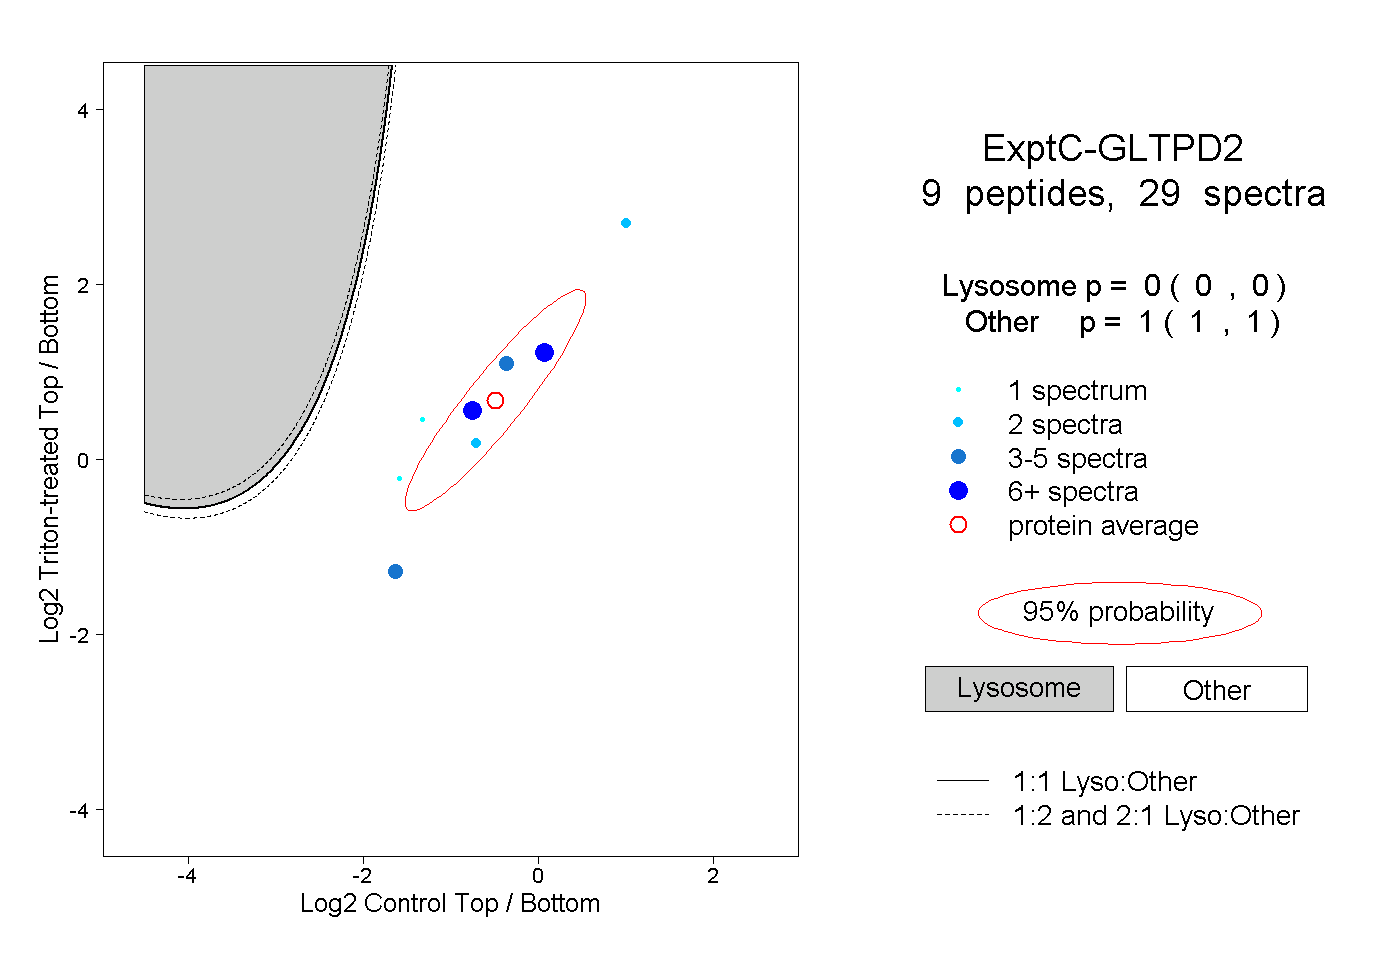 |
0.000 0.000 | 0.000 |
1.000 1.000 | 1.000 |
||||||||
| Plot | Lyso | Other | |||||||||||
| Expt D |
2 peptides |
3 spectra |
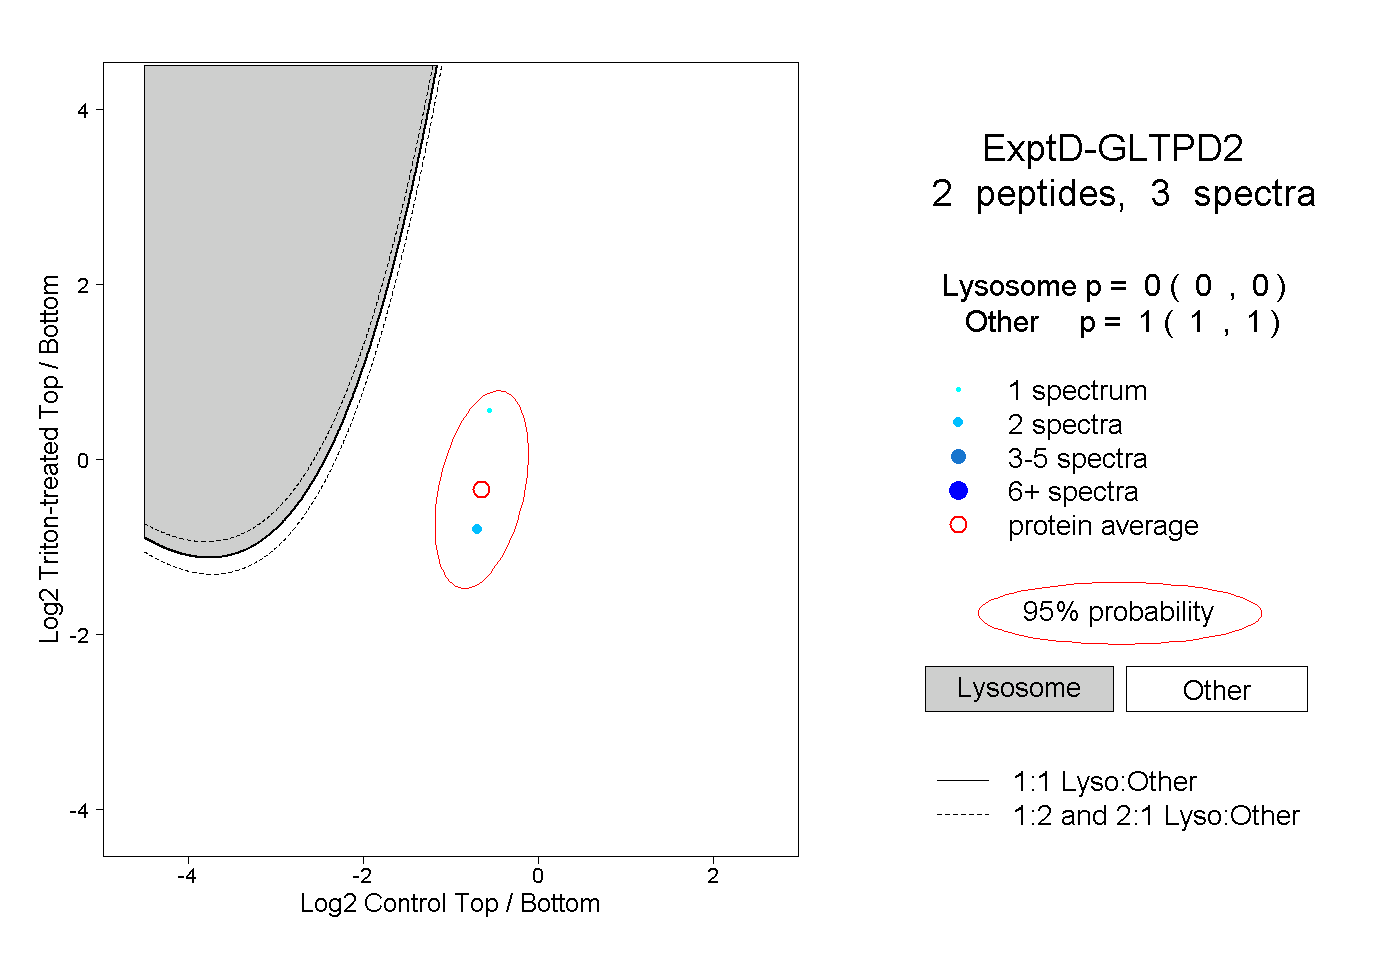 |
0.000 0.000 | 0.000 |
1.000 1.000 | 1.000 |