 4
4peptides
spectra
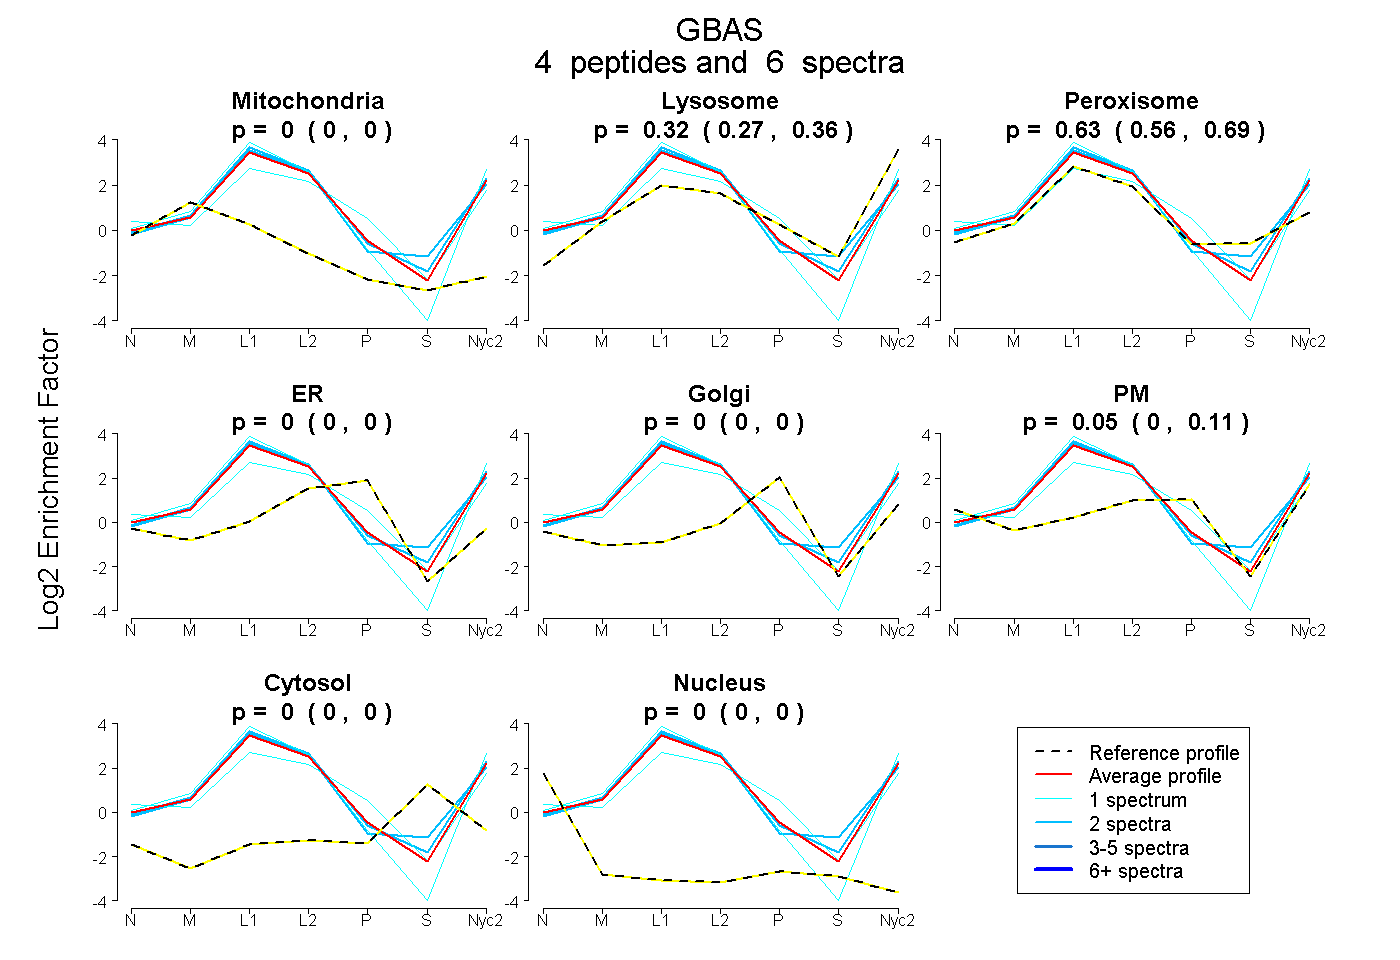
0.000 | 0.000
0.274 | 0.356
0.555 | 0.690
0.000 | 0.000
0.000 | 0.000
0.000 | 0.109
0.000 | 0.000
0.000 | 0.000
2peptides
spectra
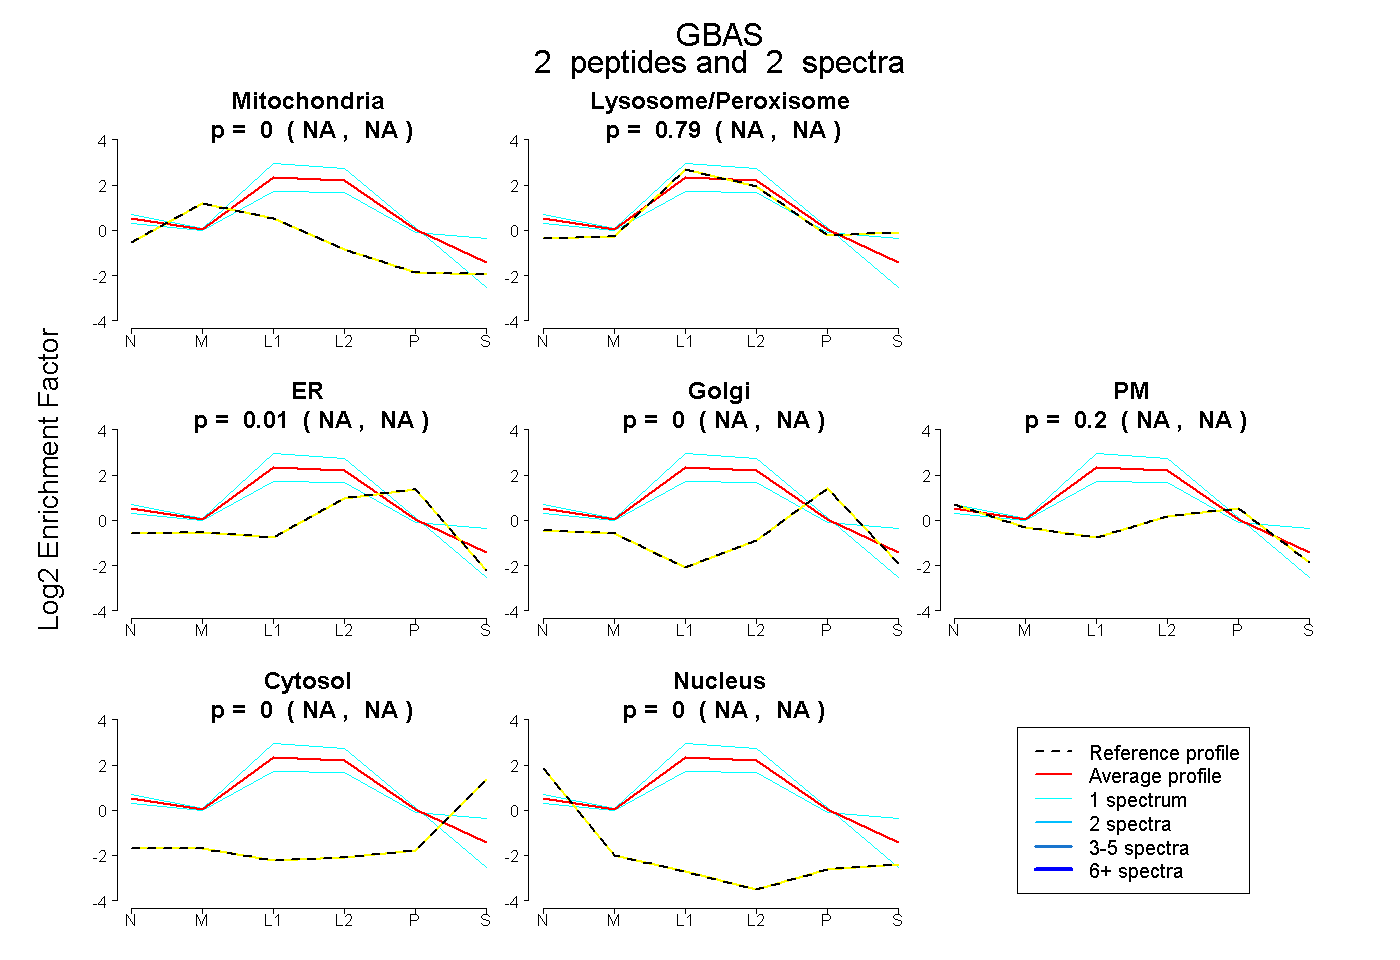
NA | NA
NA | NA
NA | NA
NA | NA
NA | NA
NA | NA
NA | NA
11peptides
spectra
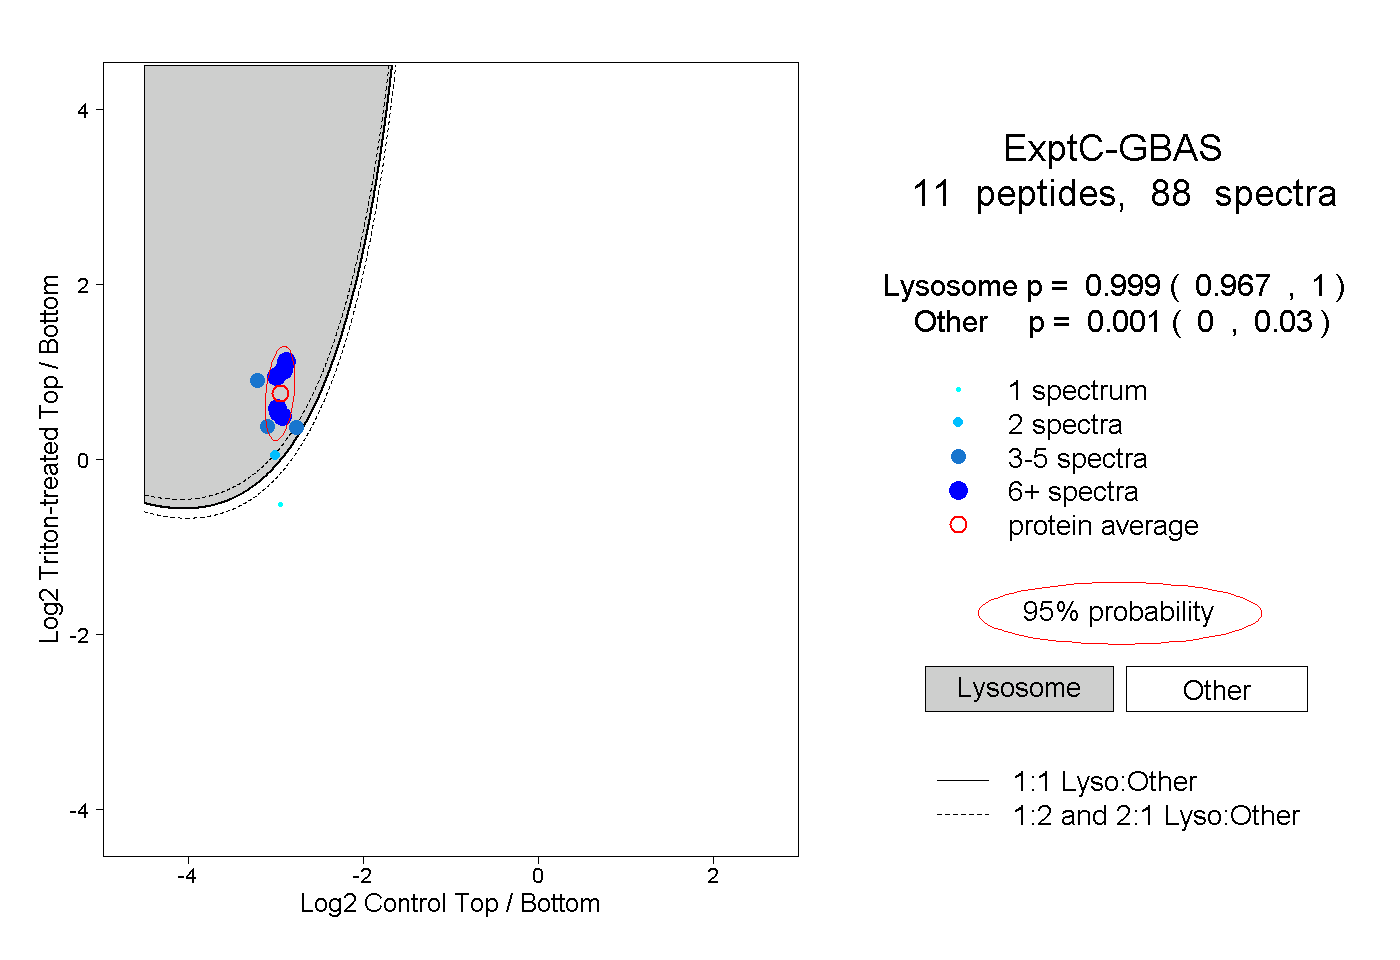
0.967 | 1.000
0.000 | 0.030
2peptides
spectra
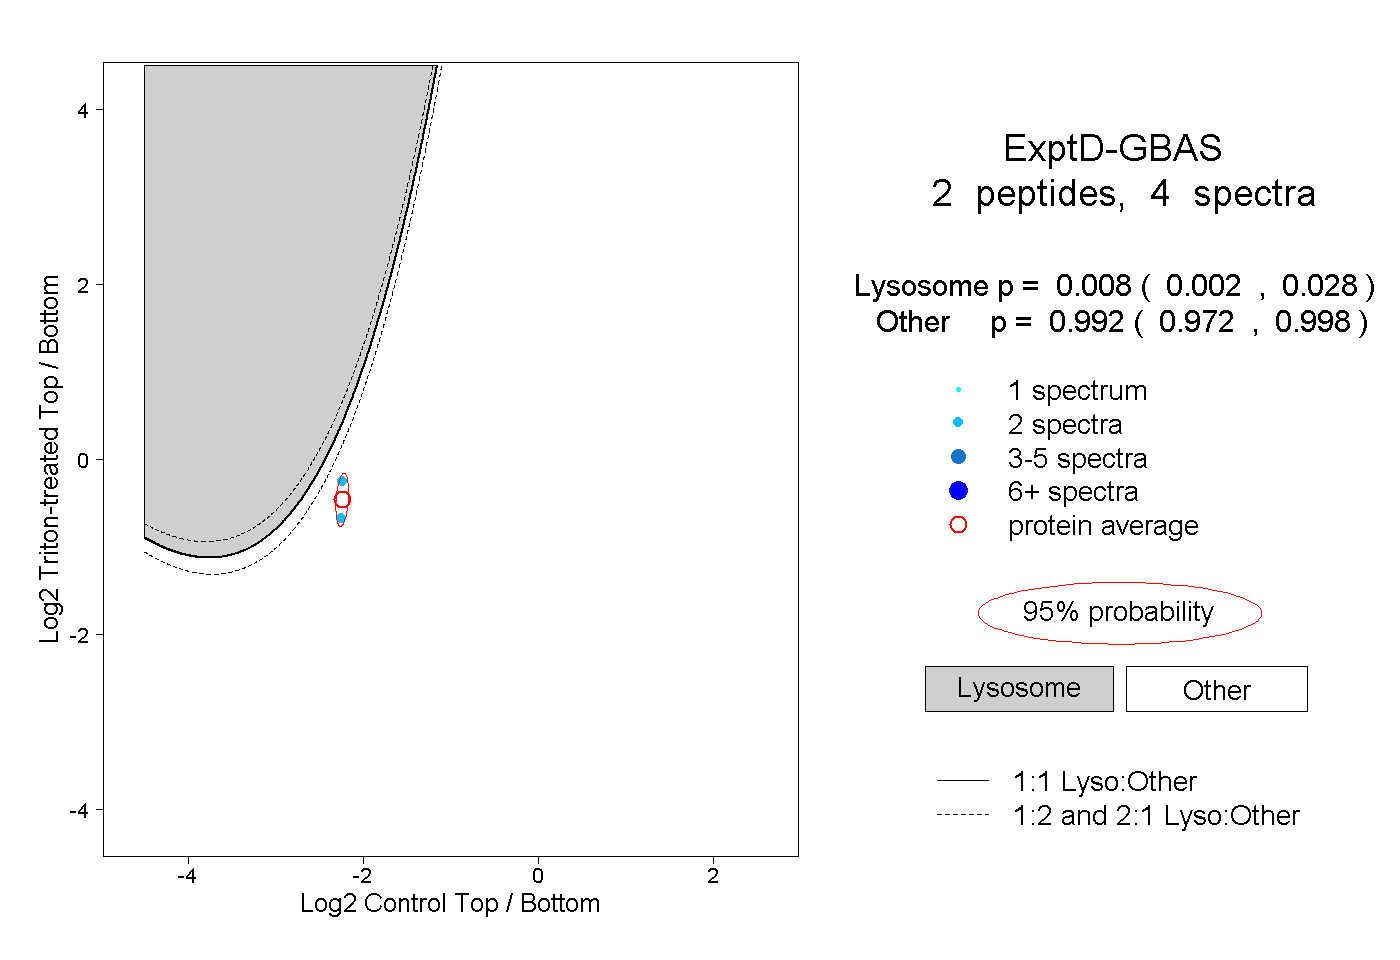
0.002 | 0.028
0.972 | 0.998