 4
4peptides
spectra
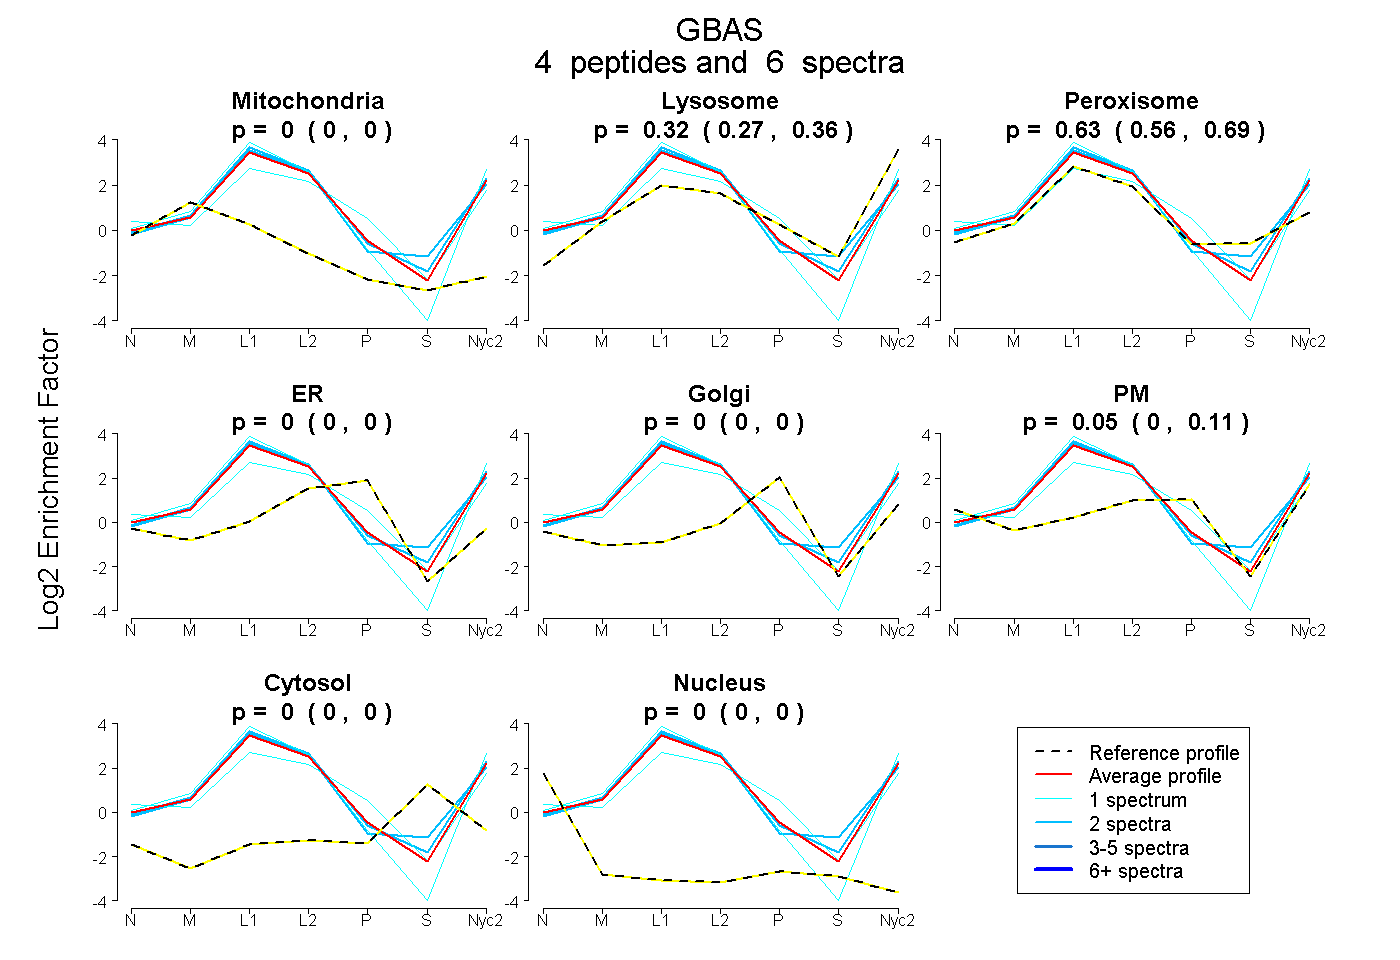
0.000 | 0.000
0.274 | 0.356
0.555 | 0.690
0.000 | 0.000
0.000 | 0.000
0.000 | 0.109
0.000 | 0.000
0.000 | 0.000
| Plot | Mito | Lyso | Perox | ER | Golgi | PM | Cytosol | Nucleus | |||||
| Expt A |
4 peptides |
6 spectra |
|
0.000 0.000 | 0.000 |
0.320 0.274 | 0.356 |
0.633 0.555 | 0.690 |
0.000 0.000 | 0.000 |
0.000 0.000 | 0.000 |
0.047 0.000 | 0.109 |
0.000 0.000 | 0.000 |
0.000 0.000 | 0.000 |
| 1 spectrum, SLFVR | 0.000 | 0.128 | 0.503 | 0.000 | 0.000 | 0.369 | 0.000 | 0.000 | ||
| 1 spectrum, YEGGYPALTEVMNK | 0.000 | 0.424 | 0.460 | 0.000 | 0.000 | 0.116 | 0.000 | 0.000 | ||
| 2 spectra, SGPNIYELR | 0.000 | 0.218 | 0.782 | 0.000 | 0.000 | 0.000 | 0.000 | 0.000 | ||
| 2 spectra, SDMLLSR | 0.000 | 0.340 | 0.660 | 0.000 | 0.000 | 0.000 | 0.000 | 0.000 |
| Plot | Mito | Lyso or Perox | ER | Golgi | PM | Cytosol | Nucleus | ||||||
| Expt B |
2 peptides |
2 spectra |
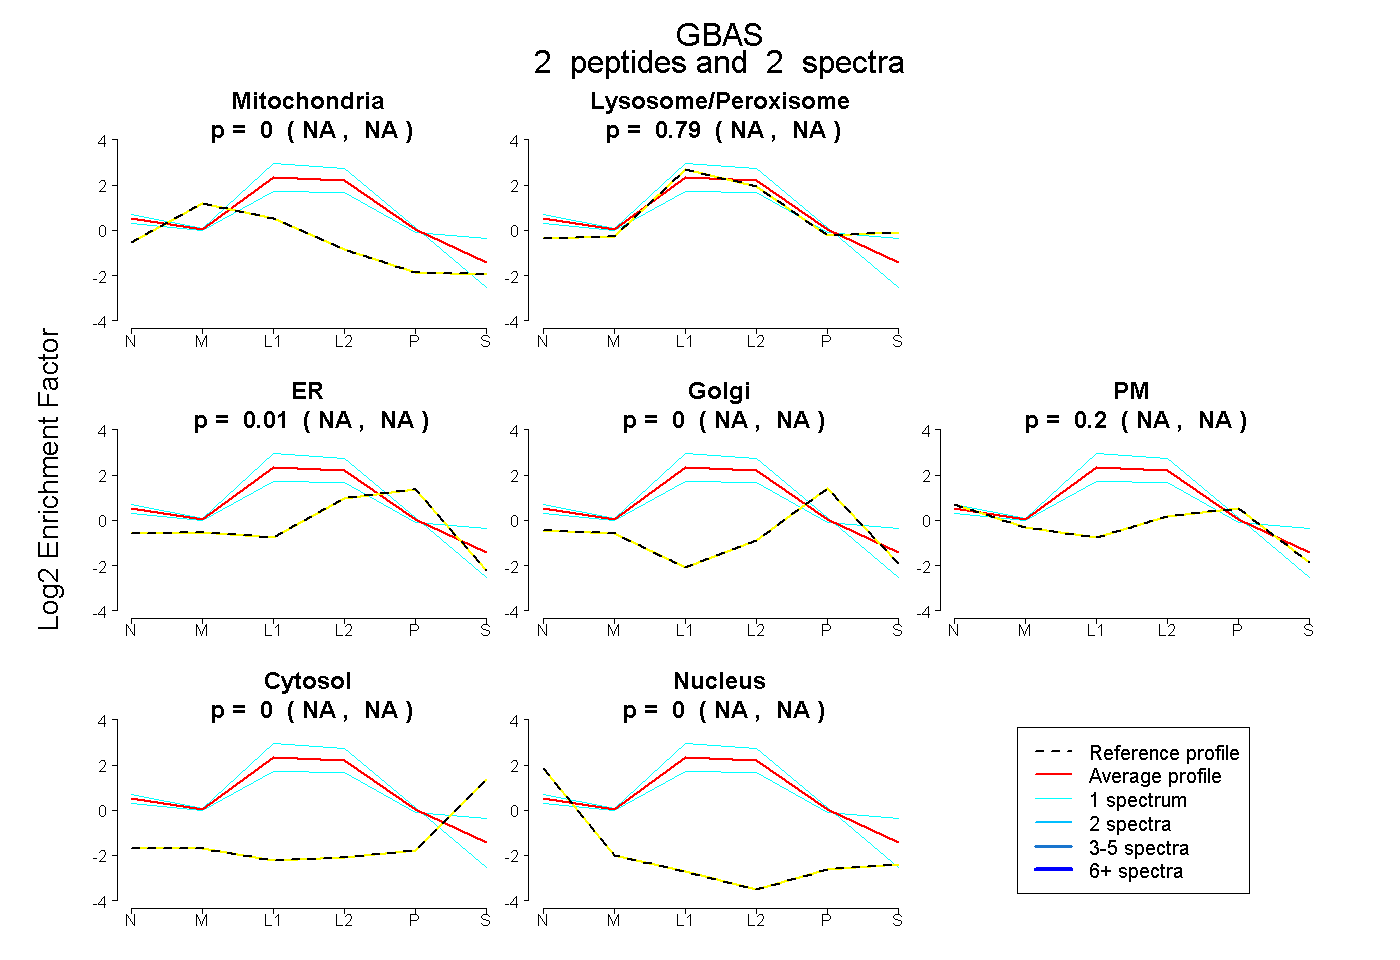 |
0.000 NA | NA |
0.787 NA | NA |
0.008 NA | NA |
0.000 NA | NA |
0.204 NA | NA |
0.000 NA | NA |
0.000 NA | NA |
|||
| Plot | Lyso | Other | |||||||||||
| Expt C |
11 peptides |
88 spectra |
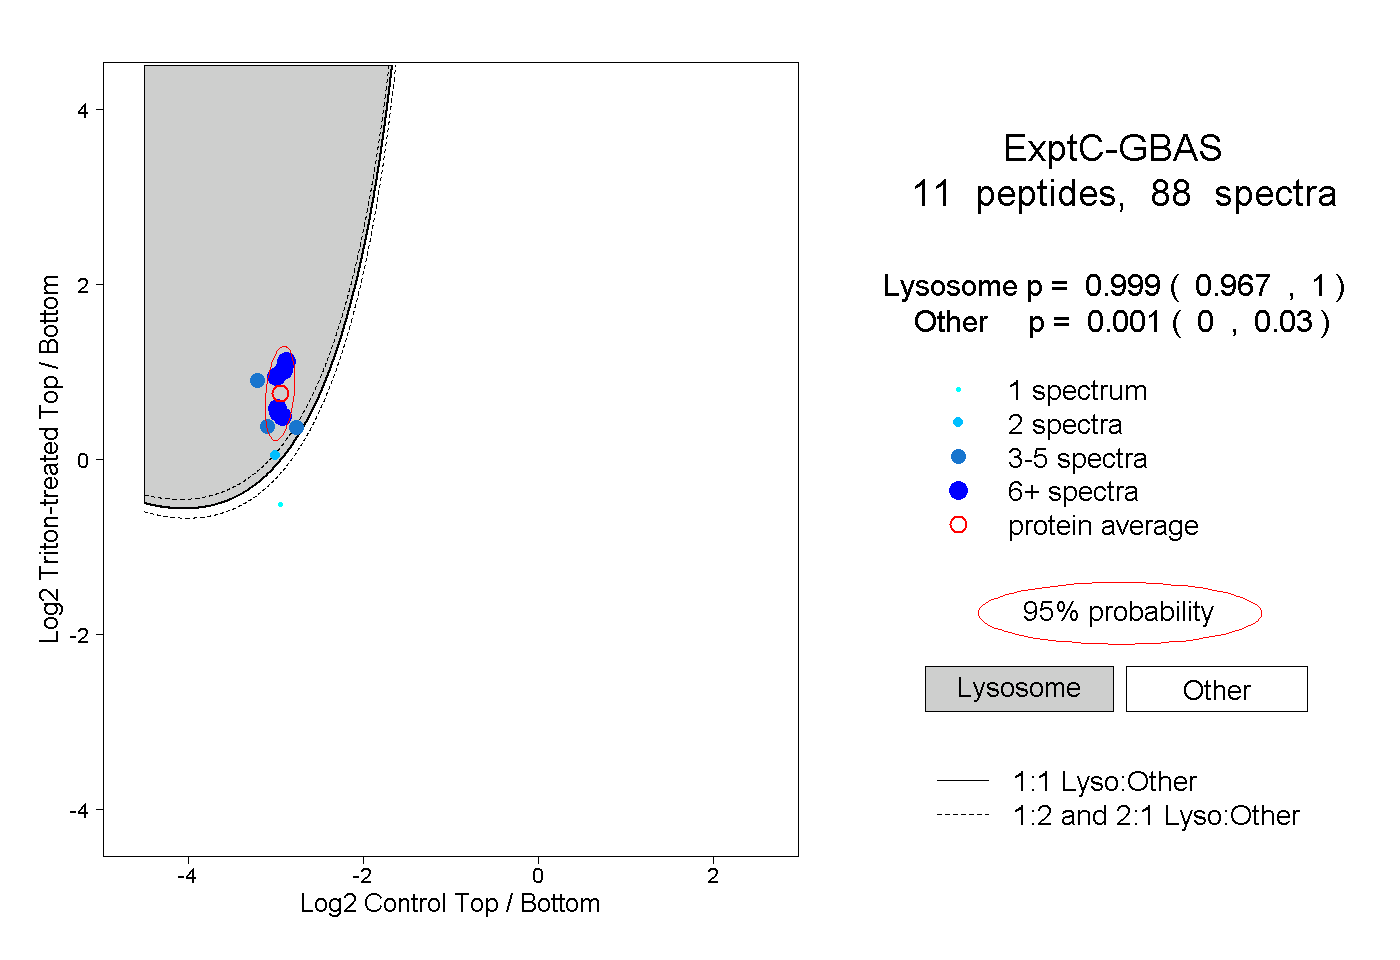 |
0.999 0.967 | 1.000 |
0.001 0.000 | 0.030 |
||||||||
| Plot | Lyso | Other | |||||||||||
| Expt D |
2 peptides |
4 spectra |
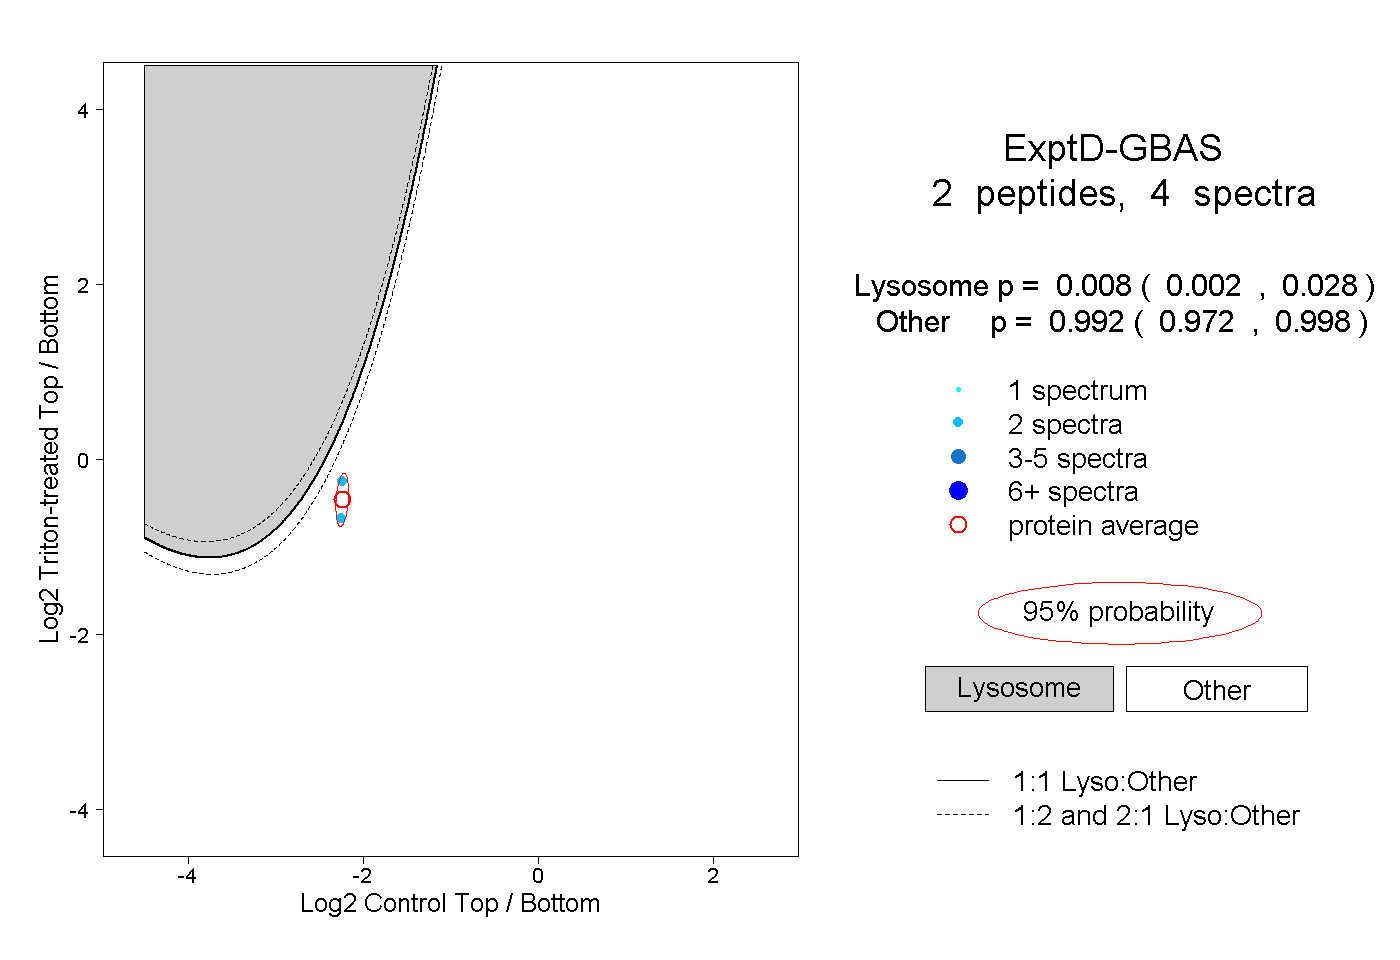 |
0.008 0.002 | 0.028 |
0.992 0.972 | 0.998 |