 11
11peptides
spectra
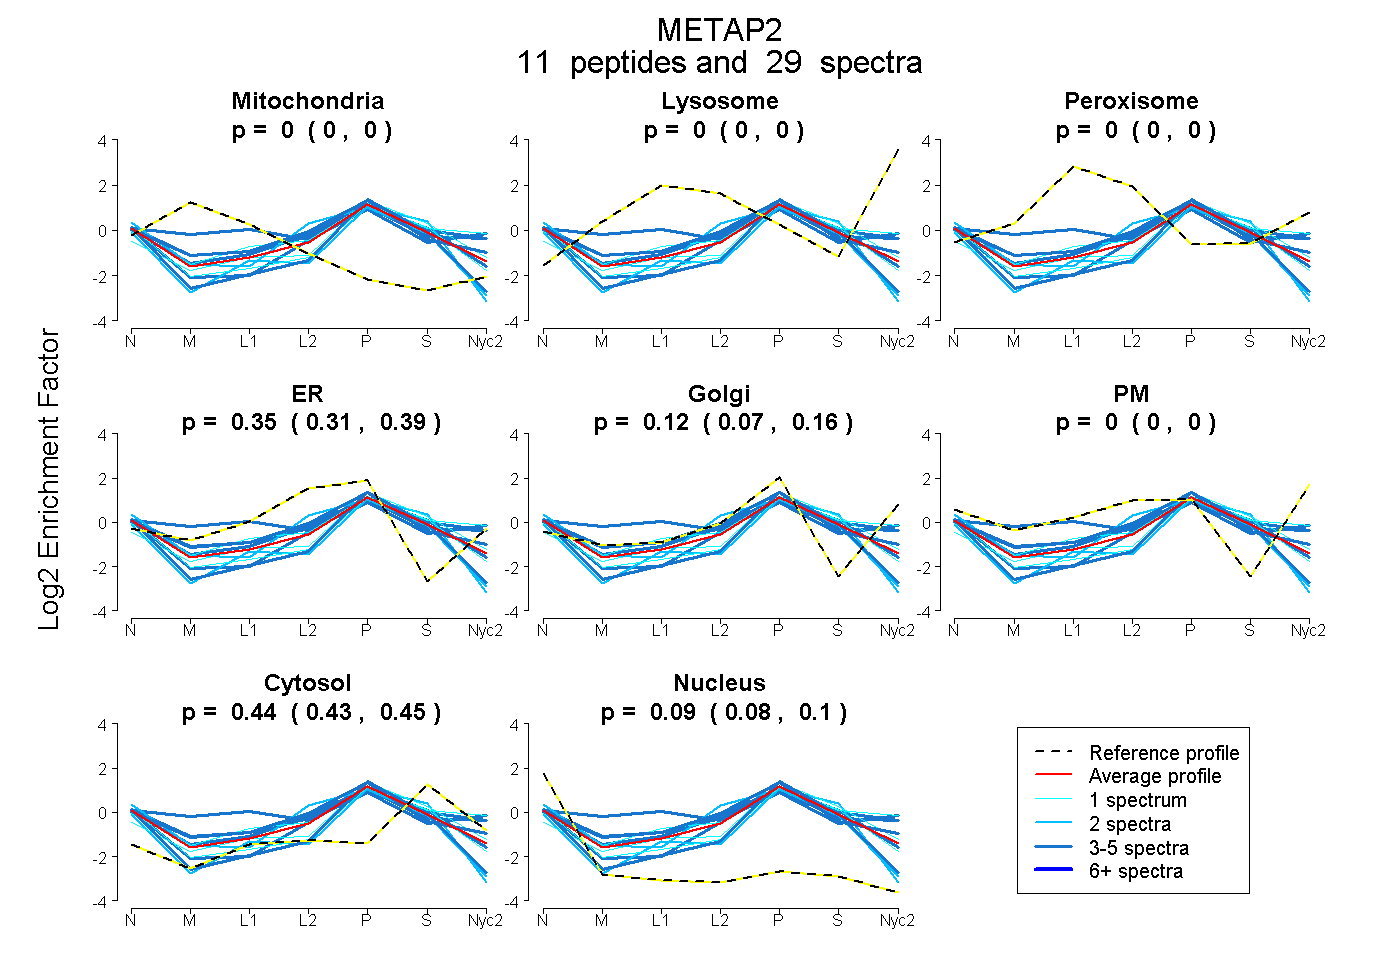
0.000 | 0.000
0.000 | 0.000
0.000 | 0.000
0.306 | 0.386
0.068 | 0.164
0.000 | 0.000
0.433 | 0.446
0.078 | 0.099
4peptides
spectra
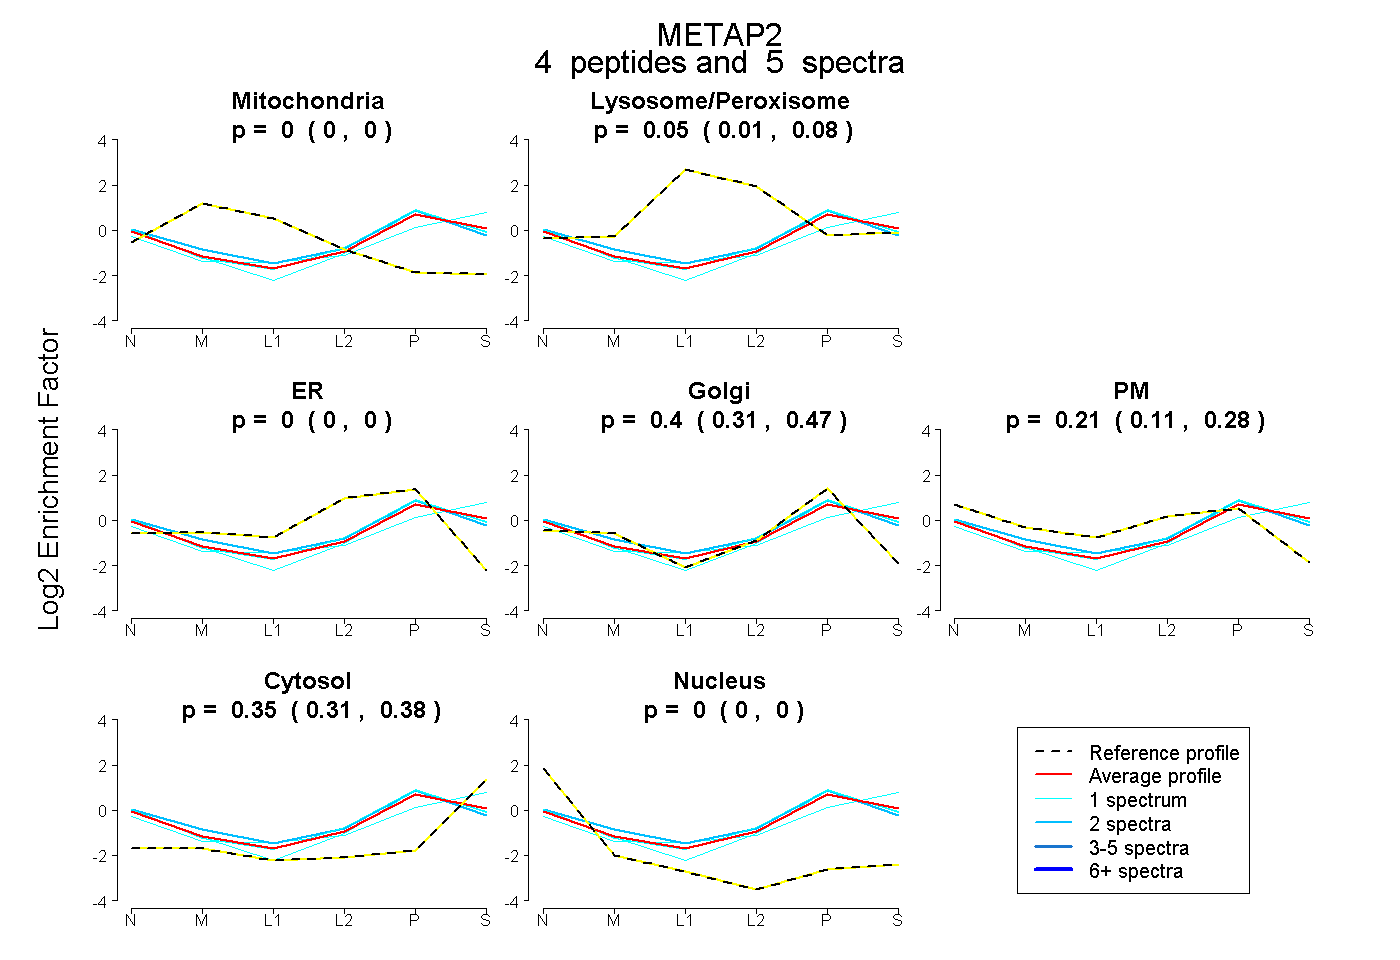
0.000 | 0.000
0.013 | 0.083
0.000 | 0.000
0.309 | 0.466
0.114 | 0.284
0.309 | 0.378
0.000 | 0.000
4peptides
spectra
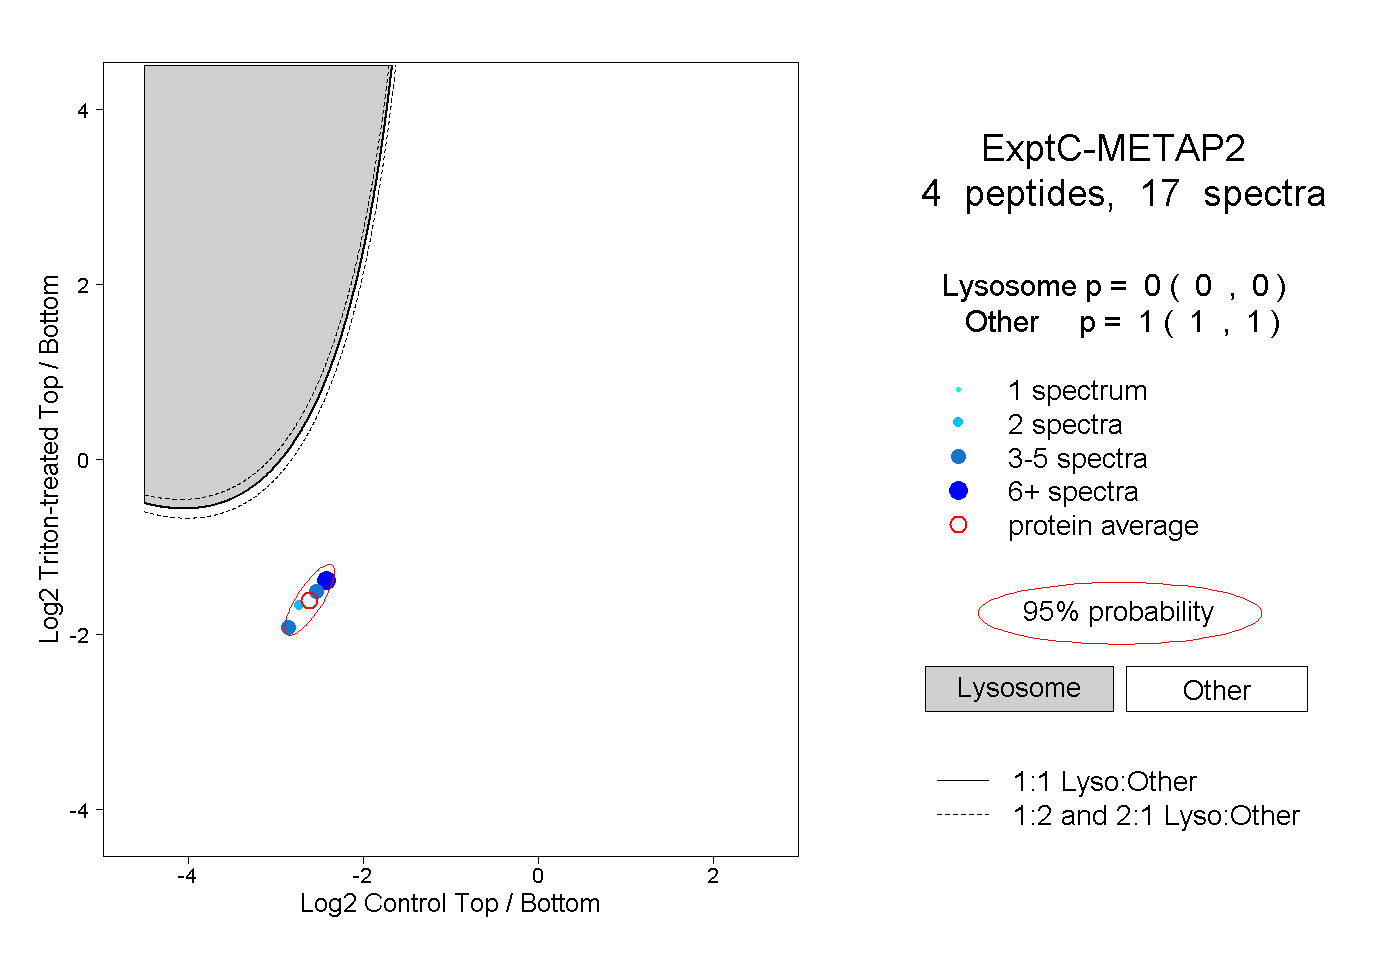
0.000 | 0.000
1.000 | 1.000