 11
11peptides
spectra
0.000 | 0.000
0.000 | 0.000
0.000 | 0.000
0.306 | 0.386
0.068 | 0.164
0.000 | 0.000
0.433 | 0.446
0.078 | 0.099
| Plot | Mito | Lyso | Perox | ER | Golgi | PM | Cytosol | Nucleus | |||||
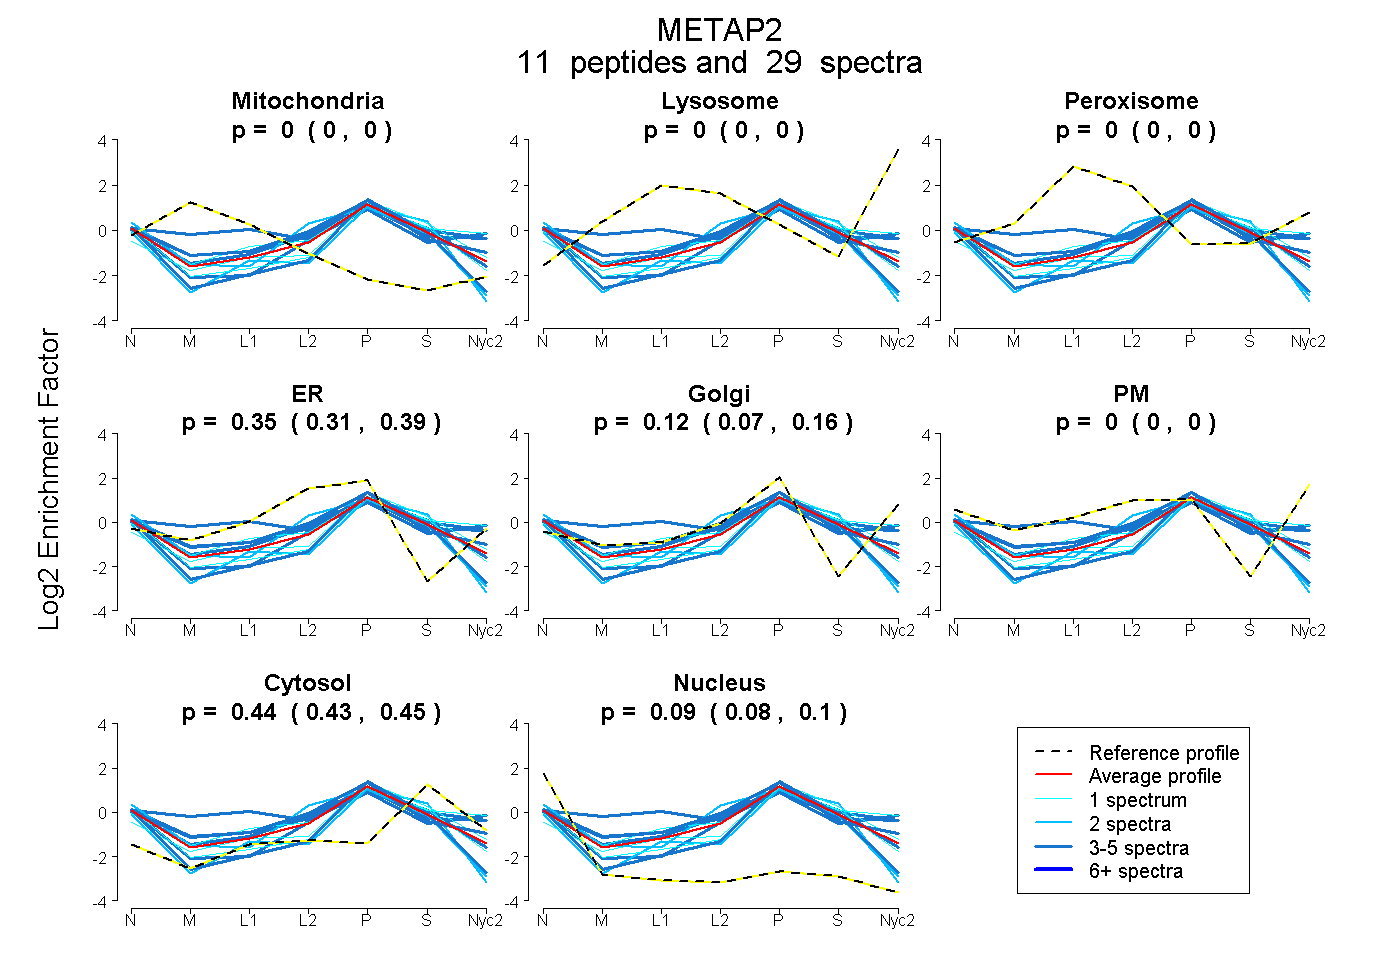
| Expt A |
11 peptides |
29 spectra |
|
0.000 0.000 | 0.000 |
0.000 0.000 | 0.000 |
0.000 0.000 | 0.000 |
0.351 0.306 | 0.386 |
0.120 0.068 | 0.164 |
0.000 0.000 | 0.000 |
0.440 0.433 | 0.446 |
0.089 0.078 | 0.099 |
| 1 spectrum, GVVHDDMECSHYMK | 0.000 | 0.000 | 0.000 | 0.087 | 0.349 | 0.000 | 0.536 | 0.027 | ||
| 4 spectra, YDILLK | 0.000 | 0.000 | 0.000 | 0.241 | 0.078 | 0.000 | 0.417 | 0.264 | ||
| 1 spectrum, TYQVKPIR | 0.000 | 0.000 | 0.000 | 0.112 | 0.261 | 0.000 | 0.466 | 0.161 | ||
| 3 spectra, GQECEYPPTQDGR | 0.000 | 0.000 | 0.000 | 0.226 | 0.327 | 0.001 | 0.446 | 0.000 | ||
| 3 spectra, ALDQASEEIWNDFR | 0.000 | 0.000 | 0.000 | 0.212 | 0.287 | 0.090 | 0.402 | 0.009 | ||
| 1 spectrum, NFDVGHVPIR | 0.000 | 0.000 | 0.052 | 0.075 | 0.445 | 0.000 | 0.428 | 0.000 | ||
| 2 spectra, GSYTAQFEHTILLRPTCK | 0.000 | 0.000 | 0.000 | 0.236 | 0.000 | 0.000 | 0.529 | 0.235 | ||
| 3 spectra, EAAEAHR | 0.000 | 0.000 | 0.000 | 0.257 | 0.146 | 0.000 | 0.465 | 0.132 | ||
| 5 spectra, TVPIVK | 0.000 | 0.000 | 0.000 | 0.463 | 0.133 | 0.000 | 0.368 | 0.036 | ||
| 4 spectra, DATNTGIK | 0.116 | 0.000 | 0.219 | 0.000 | 0.461 | 0.000 | 0.204 | 0.000 | ||
| 2 spectra, LEDCSR | 0.000 | 0.000 | 0.000 | 0.468 | 0.000 | 0.000 | 0.339 | 0.193 |
| Plot | Mito | Lyso or Perox | ER | Golgi | PM | Cytosol | Nucleus | ||||||
| Expt B |
4 peptides |
5 spectra |
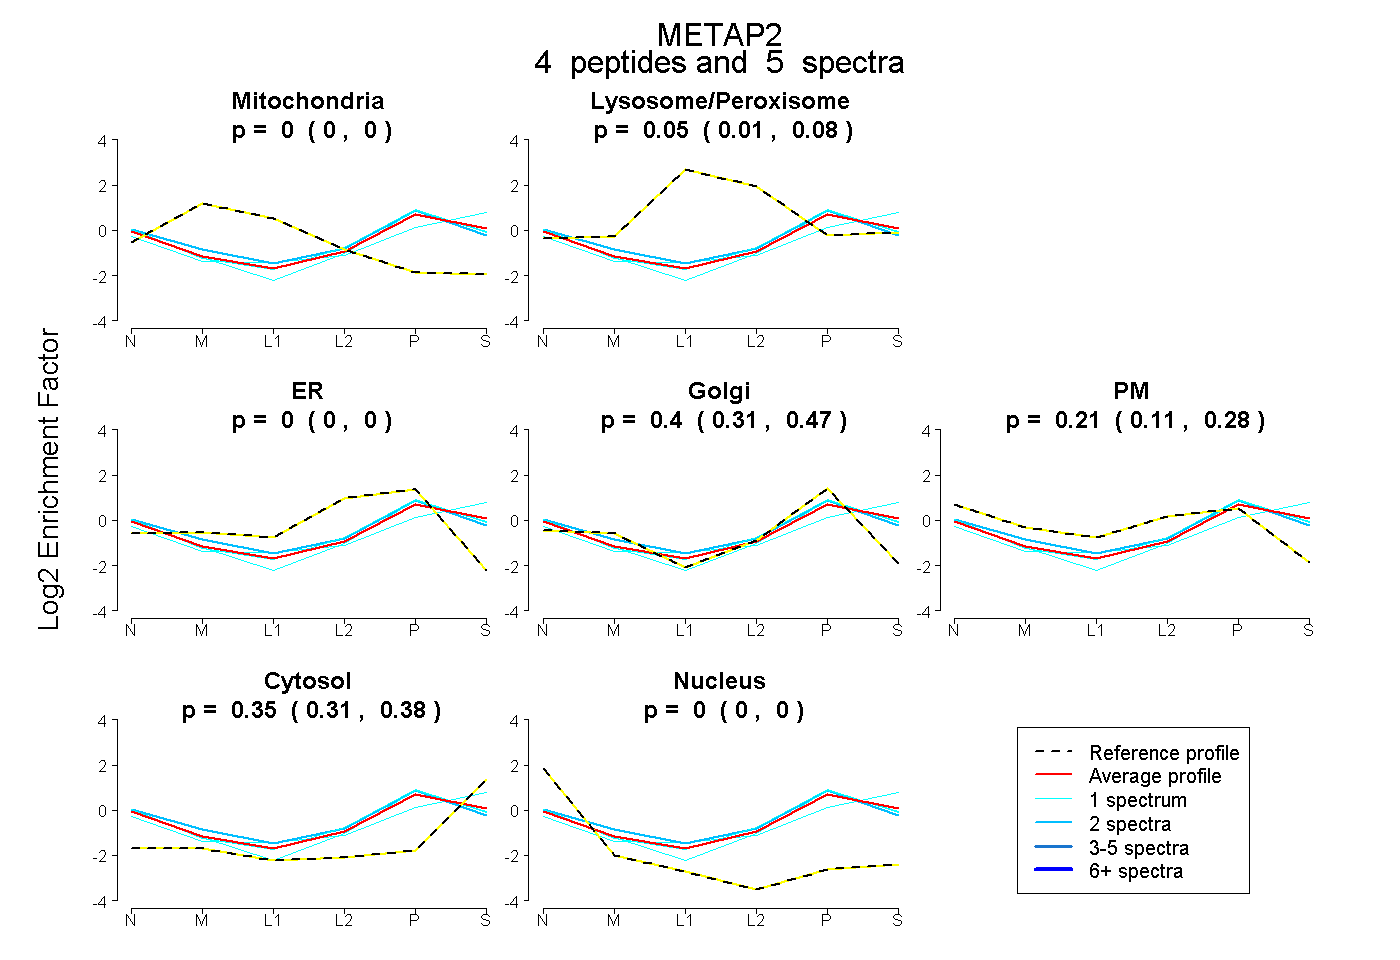 |
0.000 0.000 | 0.000 |
0.052 0.013 | 0.083 |
0.000 0.000 | 0.000 |
0.397 0.309 | 0.466 |
0.205 0.114 | 0.284 |
0.346 0.309 | 0.378 |
0.000 0.000 | 0.000 |
|||
| Plot | Lyso | Other | |||||||||||
| Expt C |
4 peptides |
17 spectra |
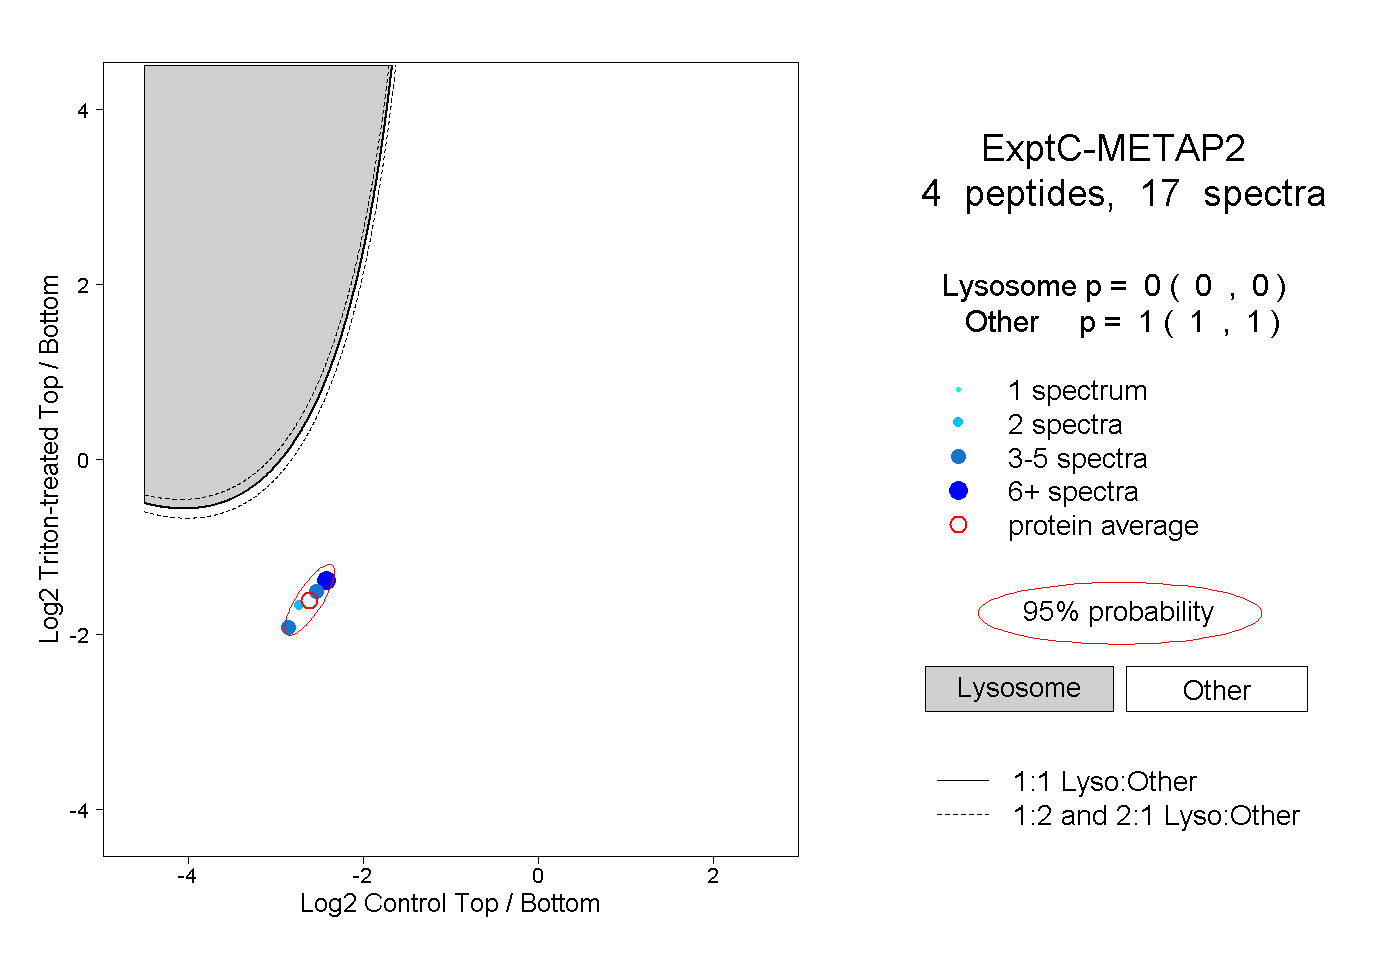 |
0.000 0.000 | 0.000 |
1.000 1.000 | 1.000 |