 12
12peptides
spectra
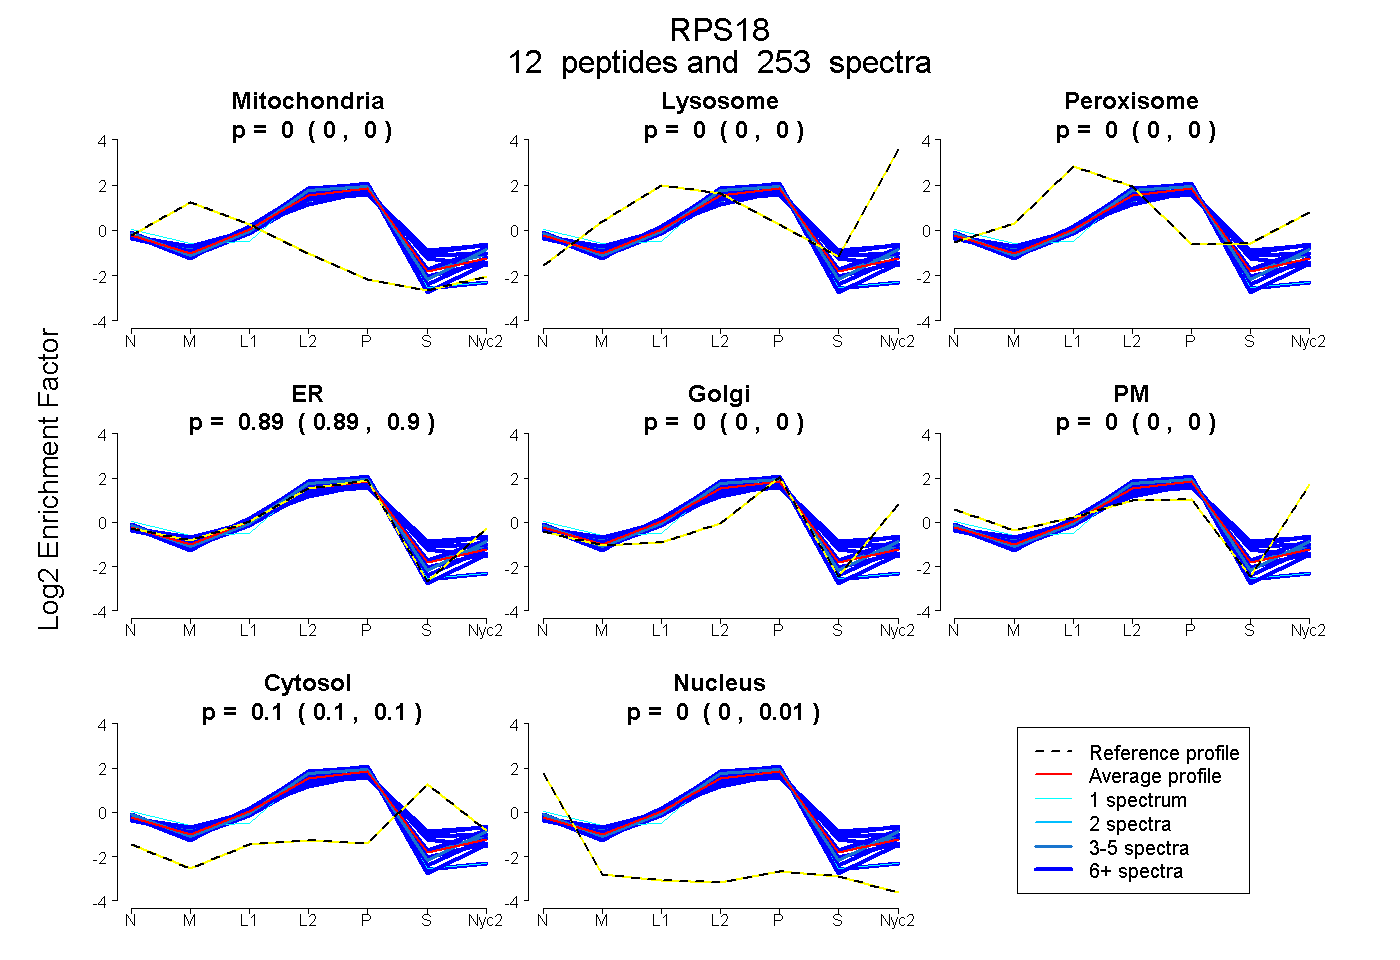
0.000 | 0.000
0.000 | 0.000
0.000 | 0.000
0.892 | 0.896
0.000 | 0.000
0.000 | 0.000
0.097 | 0.104
0.002 | 0.007
10peptides
spectra
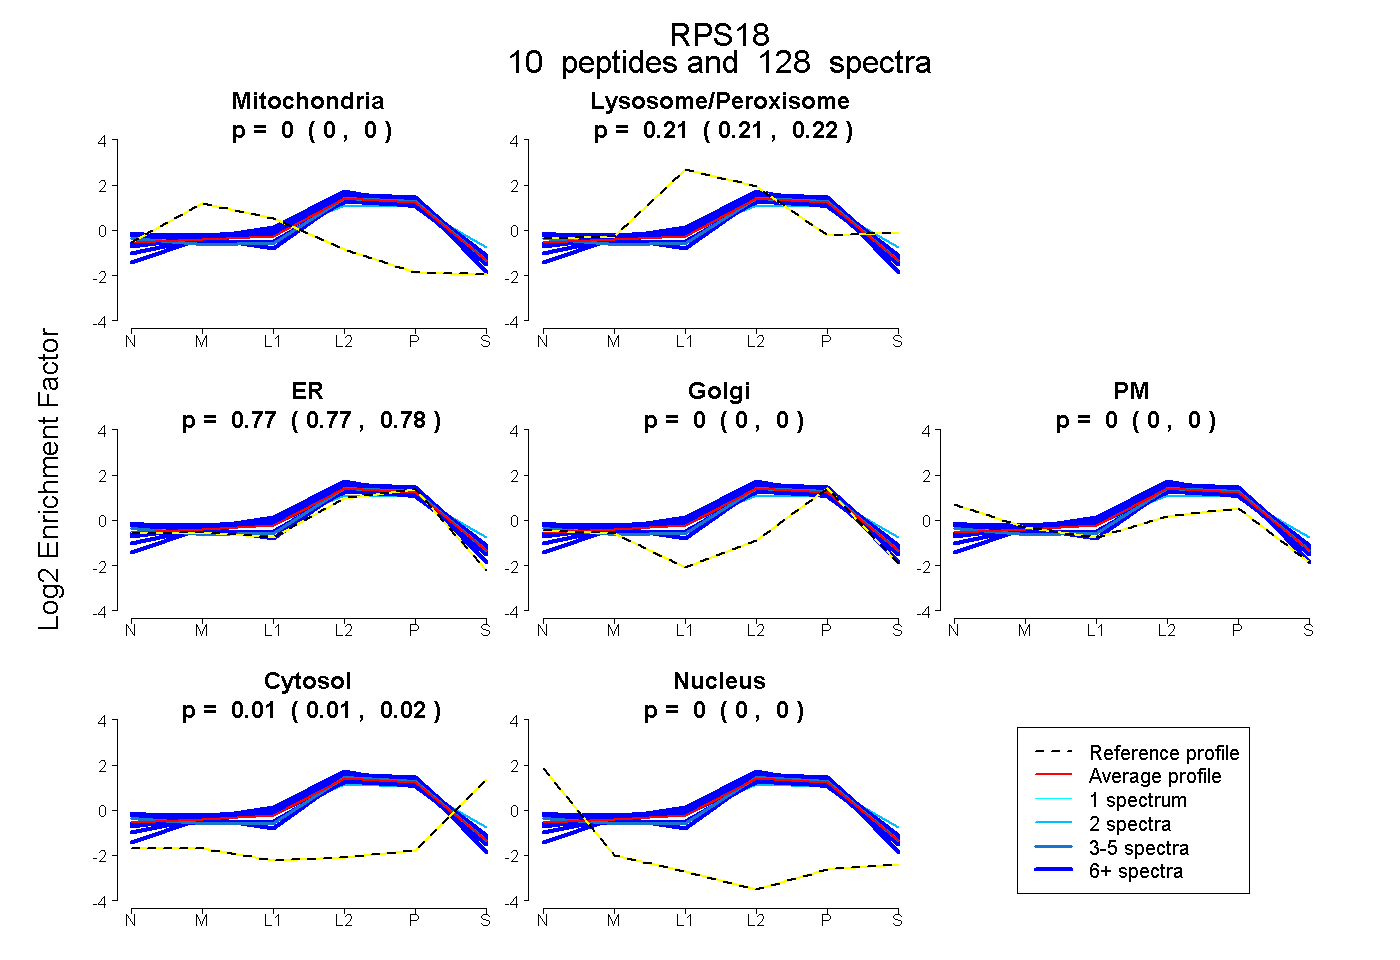
0.000 | 0.000
0.210 | 0.217
0.769 | 0.776
0.000 | 0.000
0.000 | 0.000
0.011 | 0.015
0.000 | 0.000
11peptides
spectra
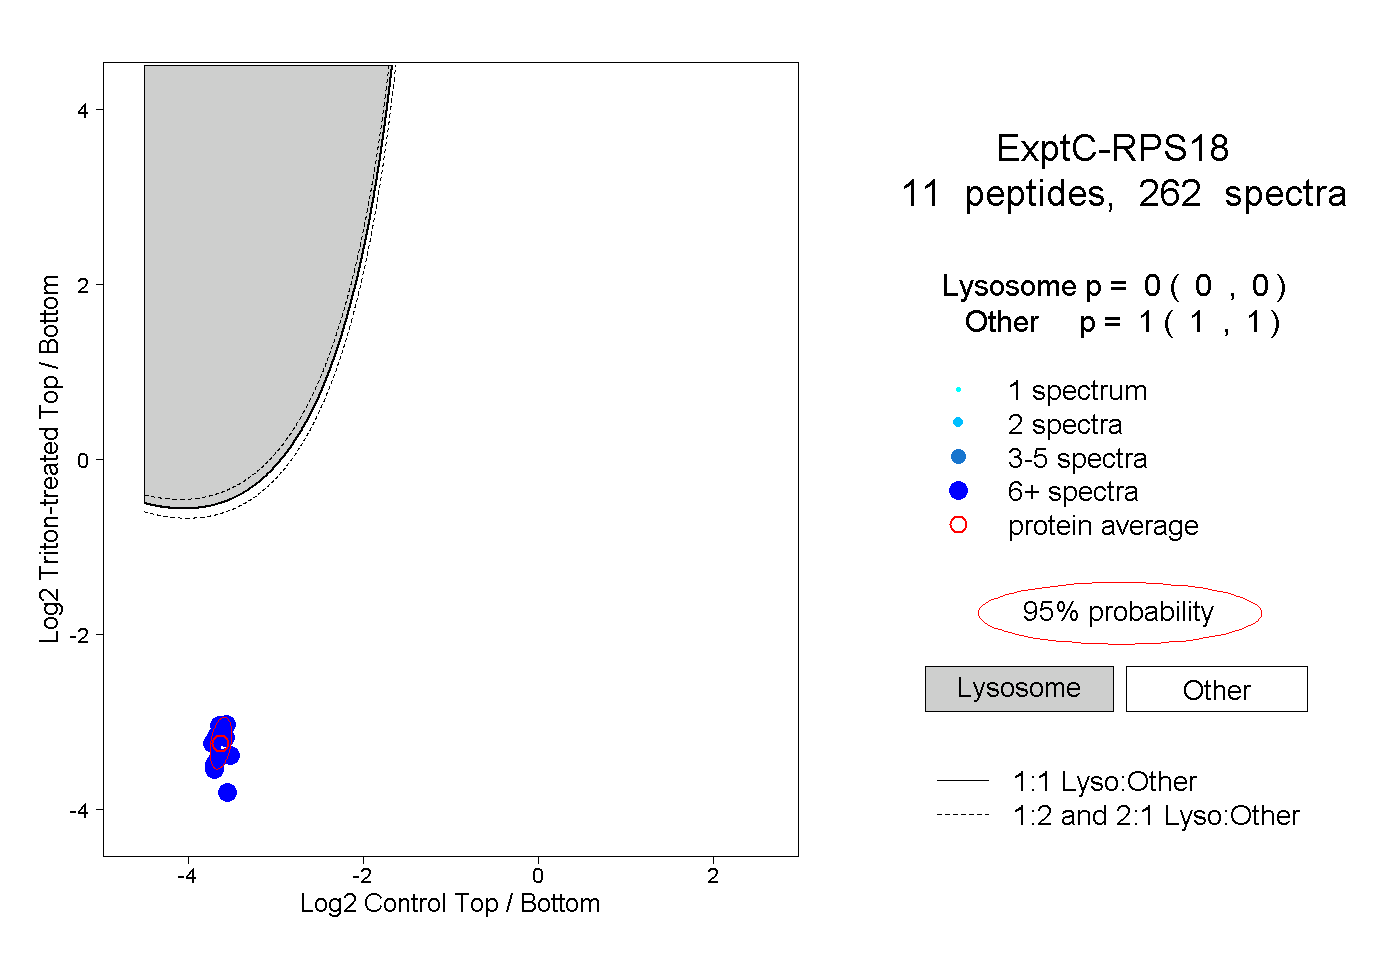
0.000 | 0.000
1.000 | 1.000
7peptides
spectra
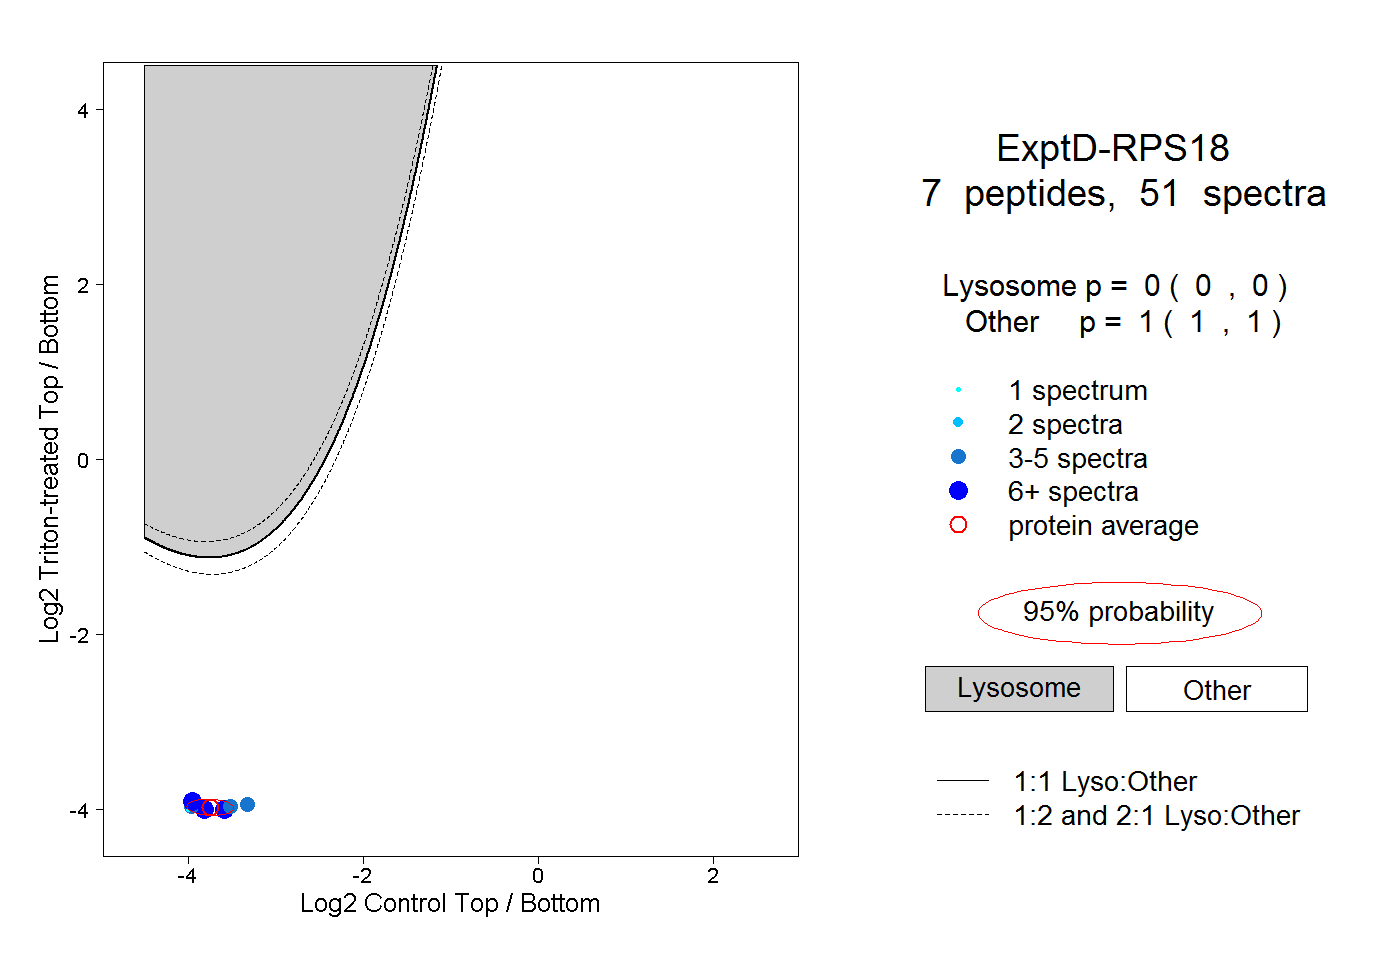
0.000 | 0.000
1.000 | 1.000