 12
12peptides
spectra
0.000 | 0.000
0.000 | 0.000
0.000 | 0.000
0.892 | 0.896
0.000 | 0.000
0.000 | 0.000
0.097 | 0.104
0.002 | 0.007
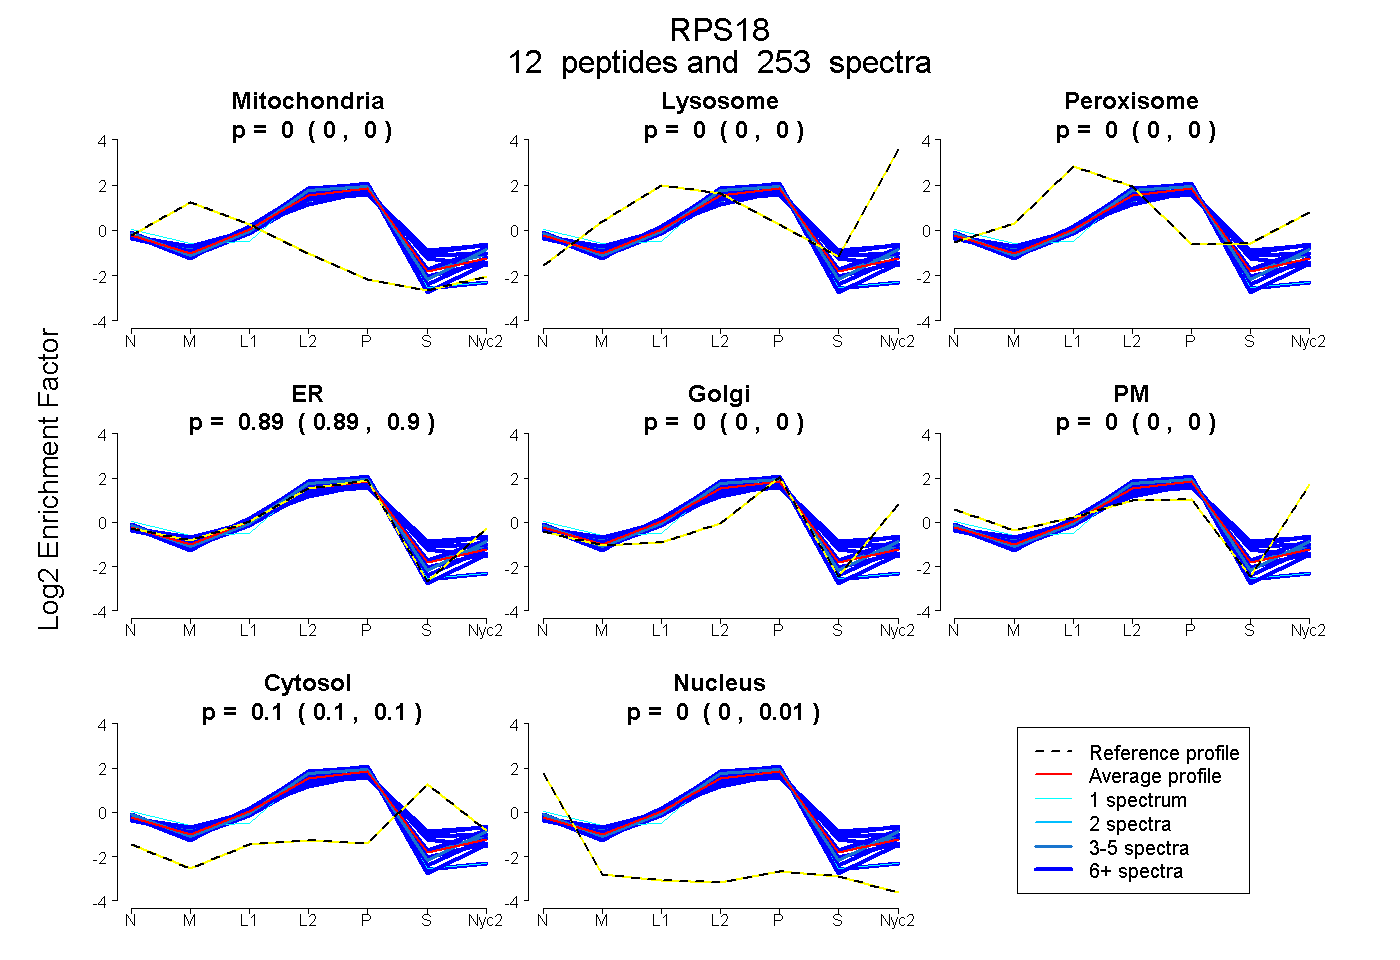
| Plot | Mito | Lyso | Perox | ER | Golgi | PM | Cytosol | Nucleus | |||||
| Expt A |
12 peptides |
253 spectra |
|
0.000 0.000 | 0.000 |
0.000 0.000 | 0.000 |
0.000 0.000 | 0.000 |
0.894 0.892 | 0.896 |
0.000 0.000 | 0.000 |
0.000 0.000 | 0.000 |
0.101 0.097 | 0.104 |
0.005 0.002 | 0.007 |
| 23 spectra, HFWGLR | 0.000 | 0.000 | 0.000 | 0.926 | 0.000 | 0.000 | 0.058 | 0.015 | ||
| 29 spectra, YAHVVLR | 0.000 | 0.000 | 0.048 | 0.756 | 0.000 | 0.000 | 0.196 | 0.000 | ||
| 12 spectra, AGELTEDEVER | 0.000 | 0.000 | 0.000 | 0.919 | 0.000 | 0.000 | 0.000 | 0.081 | ||
| 5 spectra, YSQVLANGLDNK | 0.000 | 0.000 | 0.000 | 0.952 | 0.000 | 0.000 | 0.041 | 0.007 | ||
| 31 spectra, IPDWFLNR | 0.000 | 0.000 | 0.000 | 0.961 | 0.000 | 0.000 | 0.000 | 0.039 | ||
| 5 spectra, ADIDLTK | 0.013 | 0.000 | 0.000 | 0.872 | 0.000 | 0.000 | 0.115 | 0.000 | ||
| 8 spectra, TVGVSK | 0.000 | 0.000 | 0.072 | 0.727 | 0.000 | 0.000 | 0.201 | 0.000 | ||
| 11 spectra, IAFAITAIK | 0.000 | 0.000 | 0.044 | 0.749 | 0.000 | 0.000 | 0.207 | 0.000 | ||
| 22 spectra, FQHILR | 0.000 | 0.000 | 0.000 | 0.819 | 0.000 | 0.000 | 0.181 | 0.000 | ||
| 18 spectra, VLNTNIDGR | 0.000 | 0.000 | 0.038 | 0.869 | 0.000 | 0.000 | 0.093 | 0.000 | ||
| 88 spectra, VITIMQNPR | 0.000 | 0.000 | 0.000 | 0.970 | 0.000 | 0.000 | 0.000 | 0.030 | ||
| 1 spectrum, SLVIPEK | 0.012 | 0.000 | 0.000 | 0.883 | 0.000 | 0.000 | 0.000 | 0.105 |
| Plot | Mito | Lyso or Perox | ER | Golgi | PM | Cytosol | Nucleus | ||||||
| Expt B |
10 peptides |
128 spectra |
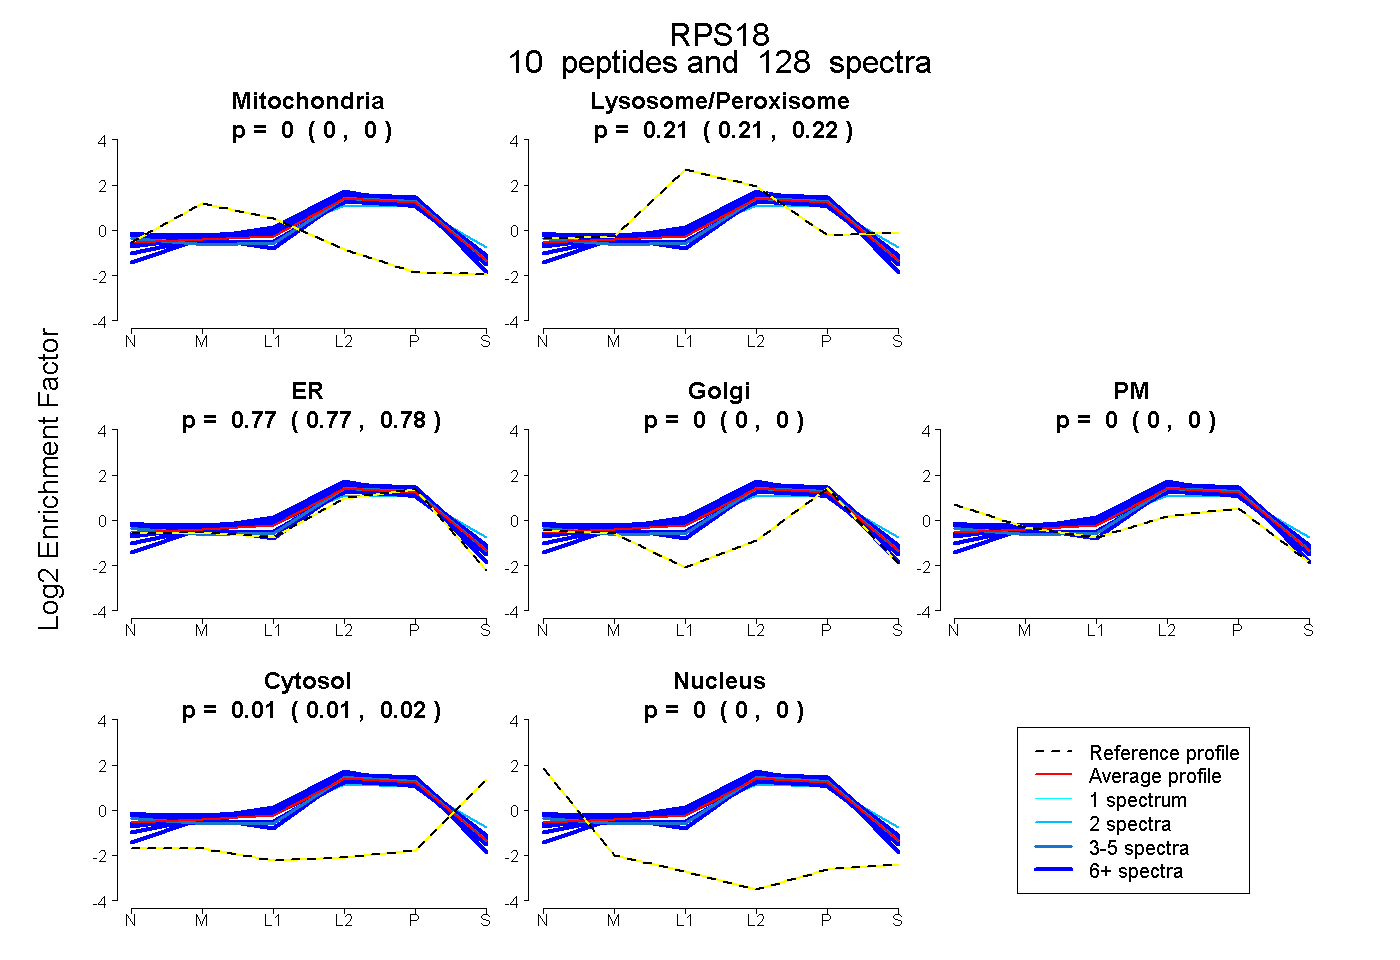 |
0.000 0.000 | 0.000 |
0.213 0.210 | 0.217 |
0.773 0.769 | 0.776 |
0.000 0.000 | 0.000 |
0.000 0.000 | 0.000 |
0.013 0.011 | 0.015 |
0.000 0.000 | 0.000 |
|||
| Plot | Lyso | Other | |||||||||||
| Expt C |
11 peptides |
262 spectra |
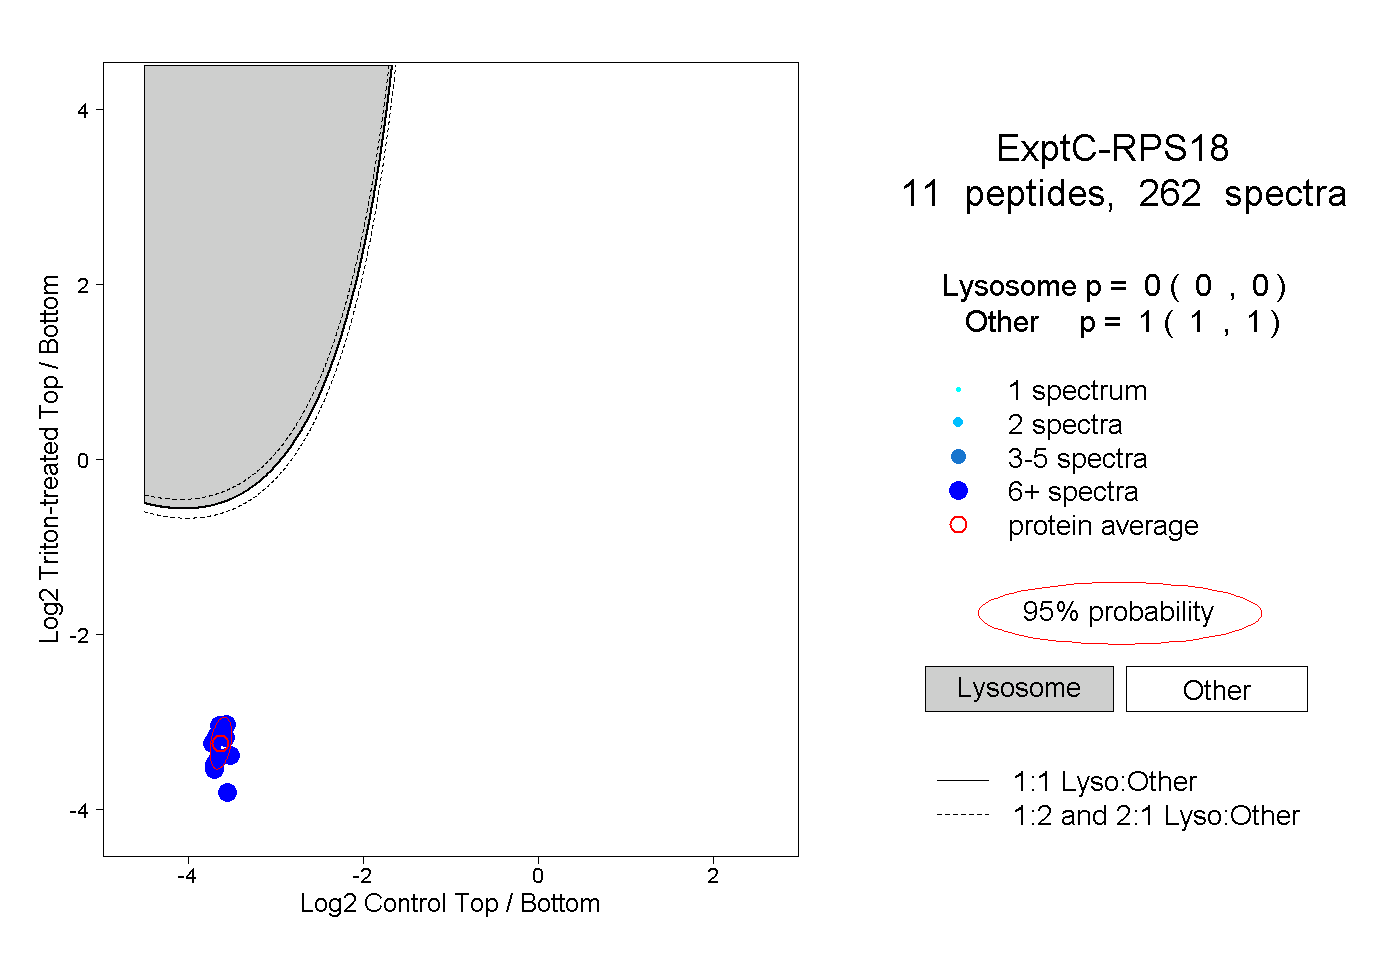 |
0.000 0.000 | 0.000 |
1.000 1.000 | 1.000 |
||||||||
| Plot | Lyso | Other | |||||||||||
| Expt D |
7 peptides |
51 spectra |
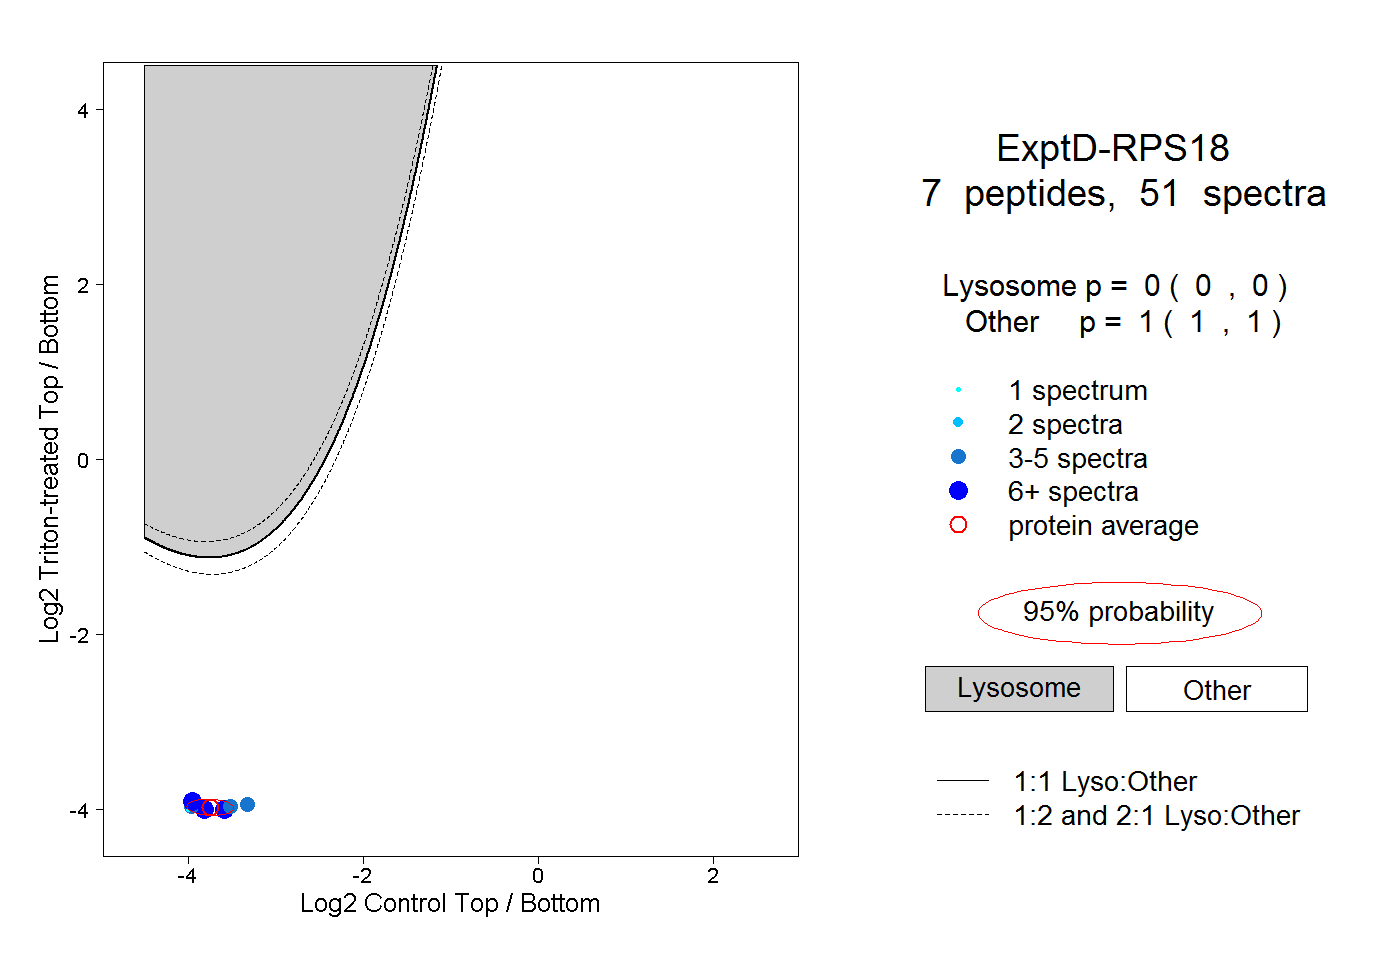 |
0.000 0.000 | 0.000 |
1.000 1.000 | 1.000 |