 10
10peptides
spectra
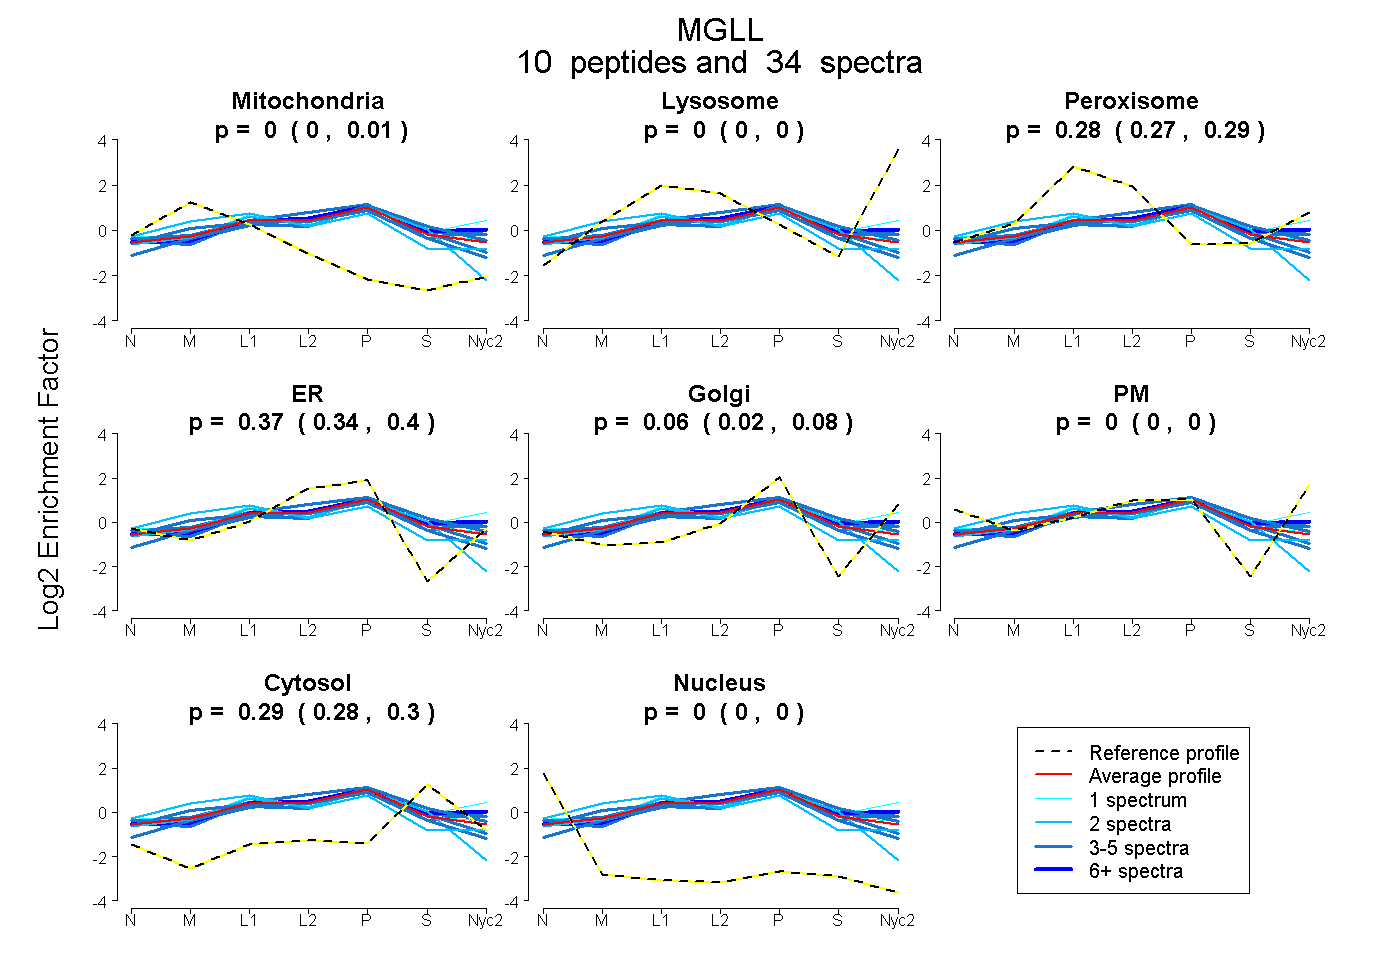
0.000 | 0.010
0.000 | 0.000
0.266 | 0.290
0.337 | 0.399
0.025 | 0.084
0.000 | 0.000
0.280 | 0.296
0.000 | 0.000
3peptides
spectra
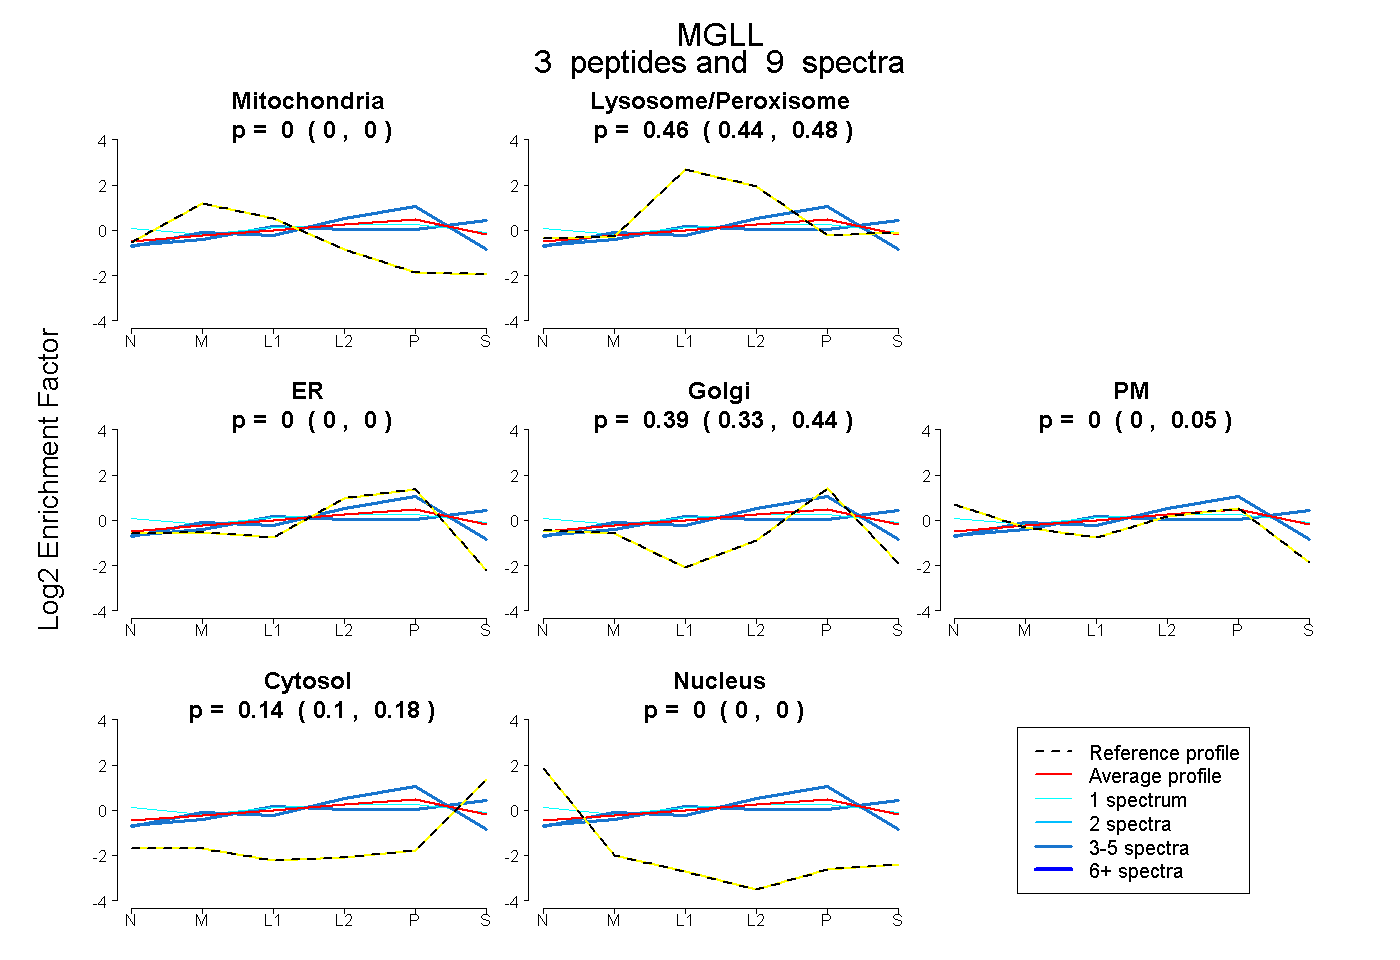
0.000 | 0.000
0.437 | 0.476
0.000 | 0.000
0.326 | 0.435
0.000 | 0.050
0.101 | 0.181
0.000 | 0.000
10peptides
spectra
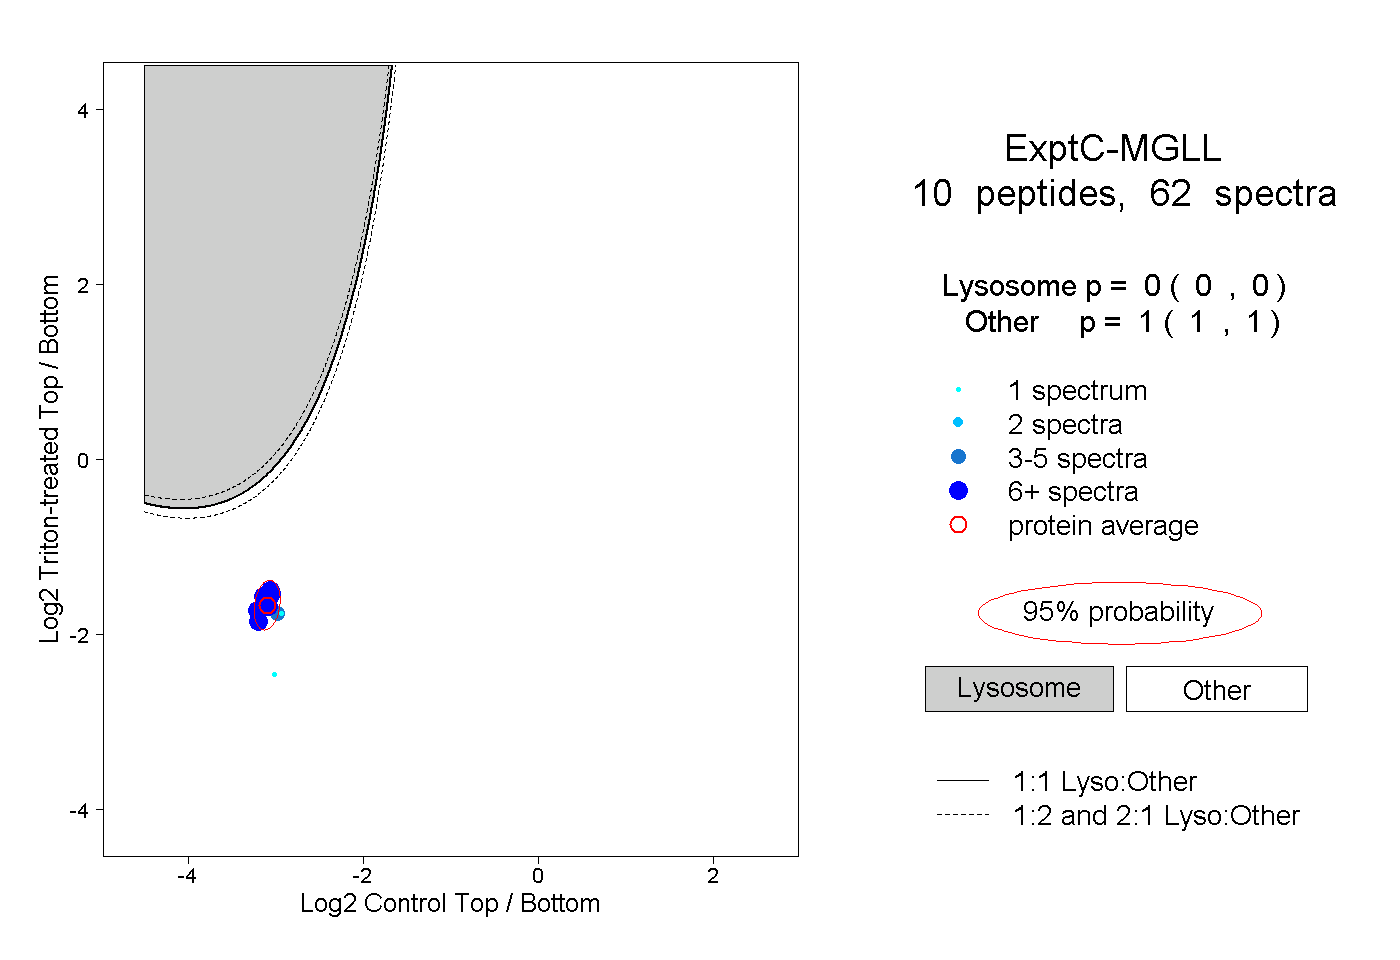
0.000 | 0.000
1.000 | 1.000
1peptide
spectrum
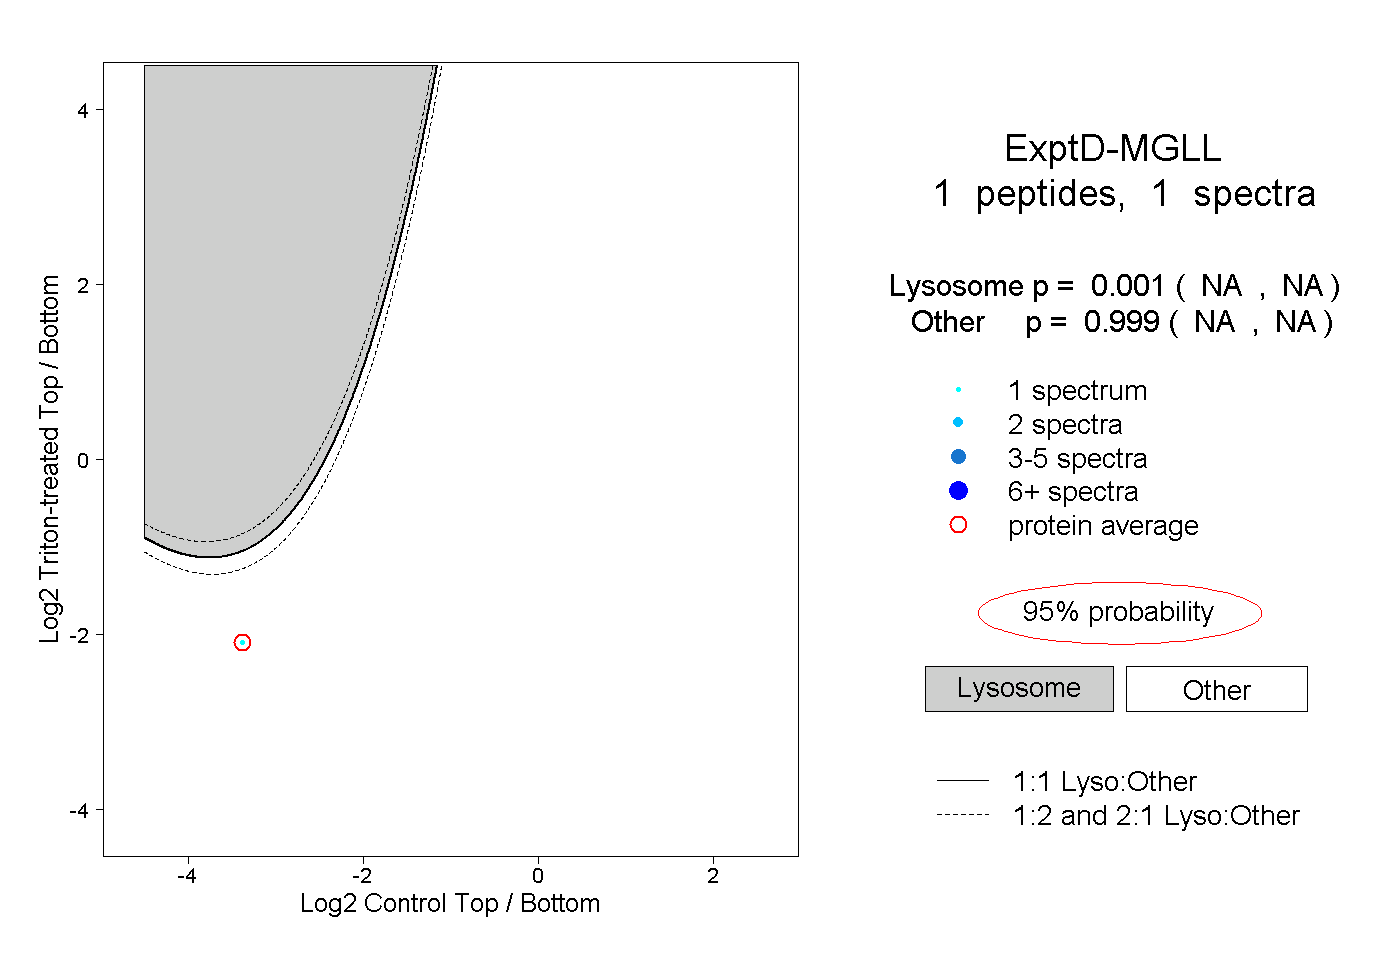
NA | NA
NA | NA