 10
10peptides
spectra
0.000 | 0.010
0.000 | 0.000
0.266 | 0.290
0.337 | 0.399
0.025 | 0.084
0.000 | 0.000
0.280 | 0.296
0.000 | 0.000
| Plot | Mito | Lyso | Perox | ER | Golgi | PM | Cytosol | Nucleus | |||||
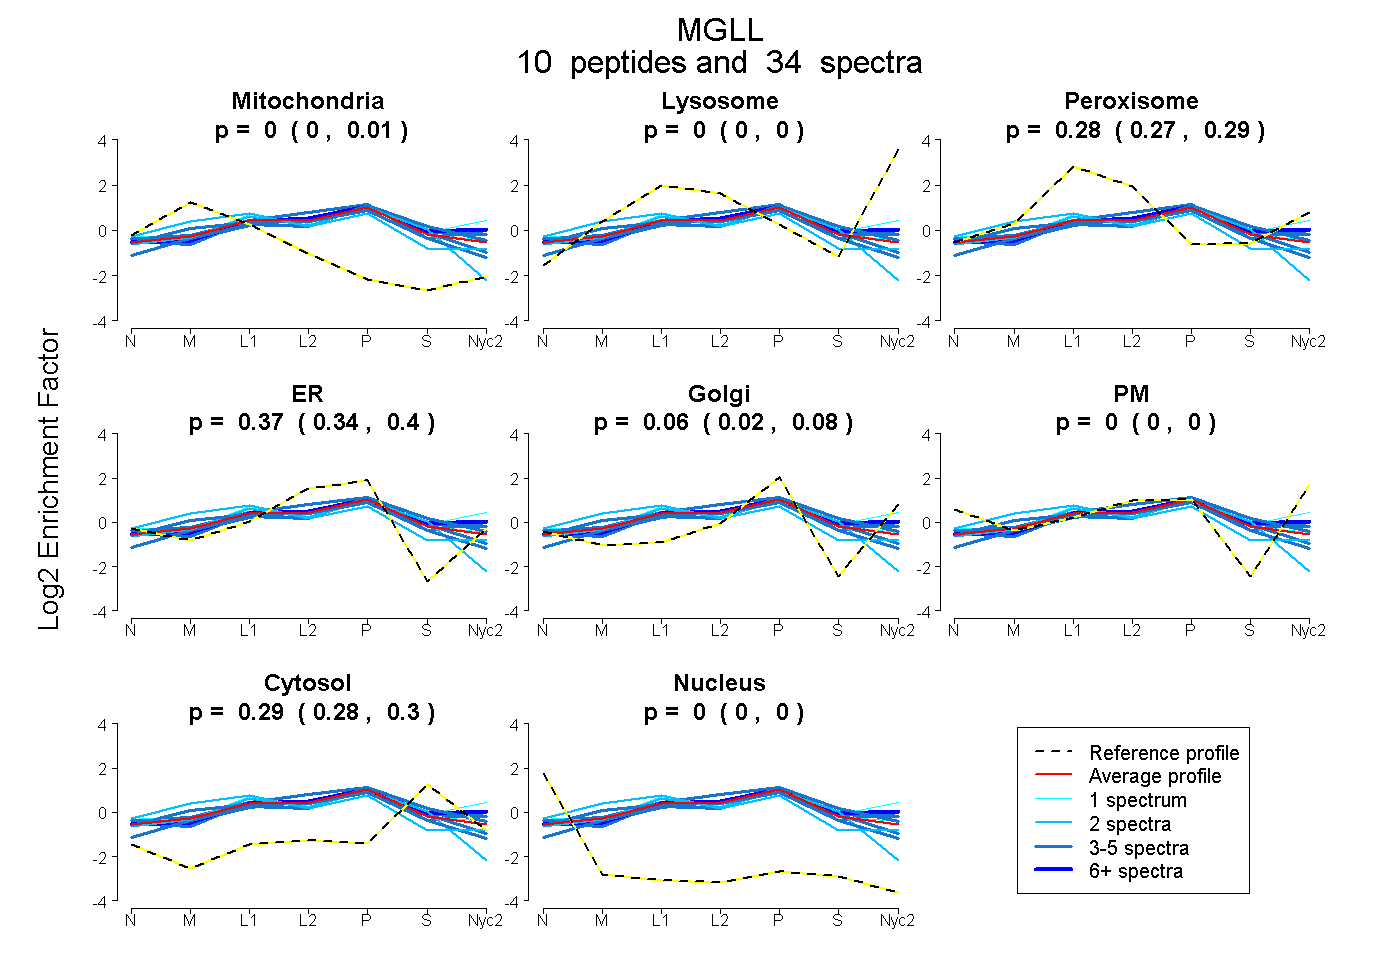
| Expt A |
10 peptides |
34 spectra |
|
0.004 0.000 | 0.010 |
0.000 0.000 | 0.000 |
0.279 0.266 | 0.290 |
0.371 0.337 | 0.399 |
0.057 0.025 | 0.084 |
0.000 0.000 | 0.000 |
0.289 0.280 | 0.296 |
0.000 0.000 | 0.000 |
| 4 spectra, IDSSVLSR | 0.000 | 0.000 | 0.350 | 0.251 | 0.216 | 0.000 | 0.184 | 0.000 | ||
| 4 spectra, MYEGAYHVLHK | 0.000 | 0.000 | 0.272 | 0.215 | 0.172 | 0.000 | 0.341 | 0.000 | ||
| 4 spectra, YDELAQMLK | 0.134 | 0.000 | 0.198 | 0.417 | 0.000 | 0.000 | 0.251 | 0.000 | ||
| 5 spectra, ALIFVSHGAGEHCGR | 0.000 | 0.000 | 0.215 | 0.447 | 0.000 | 0.000 | 0.338 | 0.000 | ||
| 2 spectra, YWKPSGTPK | 0.222 | 0.000 | 0.280 | 0.267 | 0.113 | 0.000 | 0.118 | 0.000 | ||
| 1 spectrum, MPEASSPR | 0.000 | 0.000 | 0.278 | 0.376 | 0.074 | 0.000 | 0.272 | 0.000 | ||
| 4 spectra, DLLQHVNTVQK | 0.000 | 0.000 | 0.292 | 0.252 | 0.181 | 0.000 | 0.275 | 0.000 | ||
| 7 spectra, MVVSDFQVFVR | 0.000 | 0.000 | 0.353 | 0.123 | 0.283 | 0.000 | 0.241 | 0.000 | ||
| 2 spectra, TPQNVPYQDLPHLVNADGQYLFCR | 0.142 | 0.000 | 0.152 | 0.387 | 0.000 | 0.000 | 0.319 | 0.000 | ||
| 1 spectrum, GAYLLMESSPSQDK | 0.000 | 0.017 | 0.407 | 0.000 | 0.384 | 0.000 | 0.191 | 0.000 |
| Plot | Mito | Lyso or Perox | ER | Golgi | PM | Cytosol | Nucleus | ||||||
| Expt B |
3 peptides |
9 spectra |
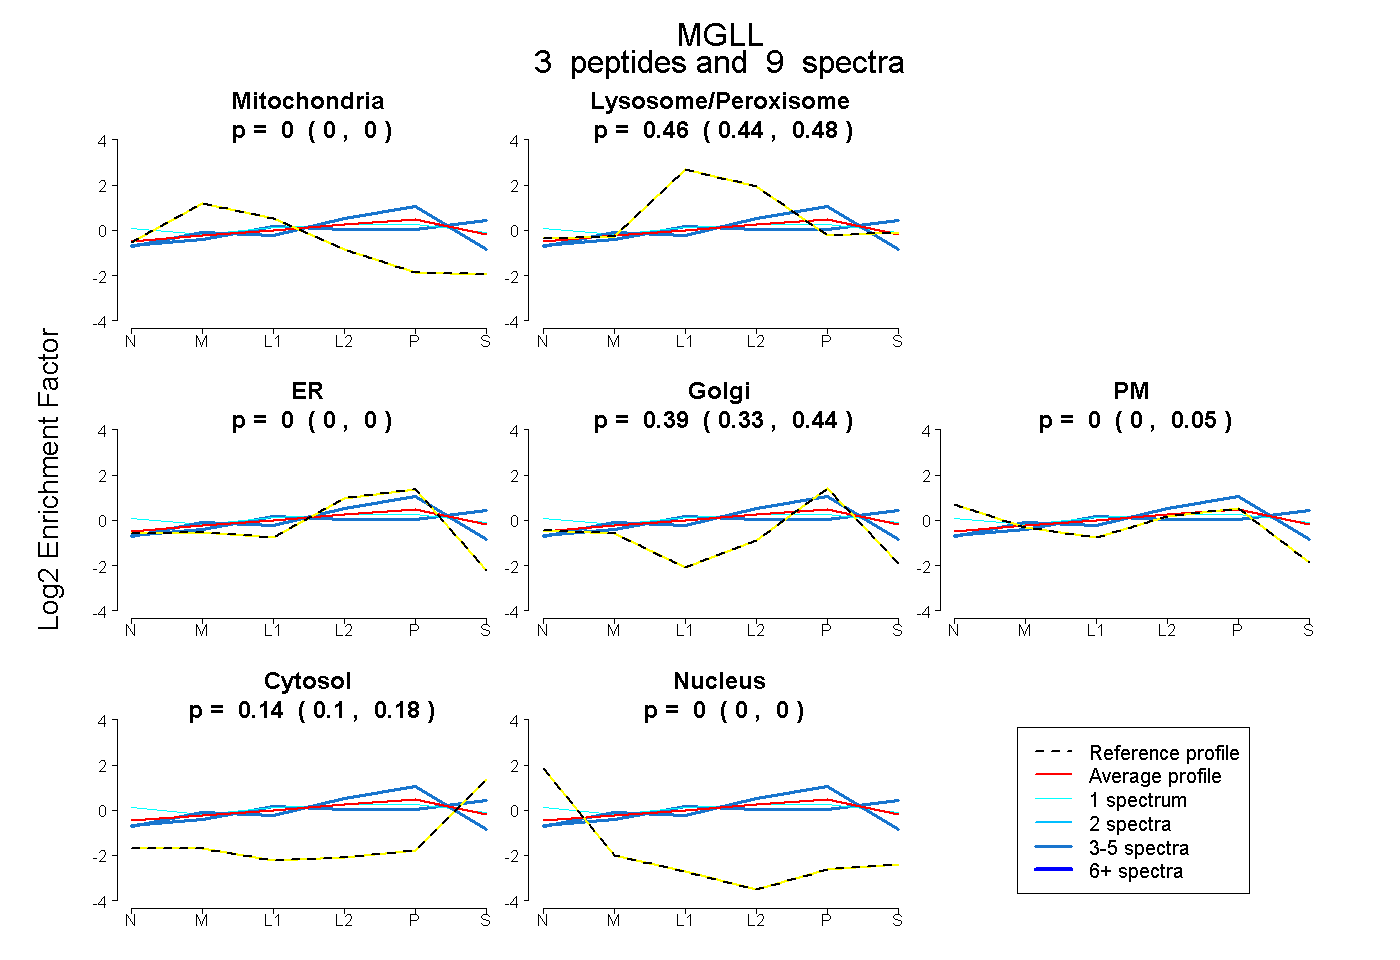 |
0.000 0.000 | 0.000 |
0.463 0.437 | 0.476 |
0.000 0.000 | 0.000 |
0.393 0.326 | 0.435 |
0.000 0.000 | 0.050 |
0.144 0.101 | 0.181 |
0.000 0.000 | 0.000 |
|||
| Plot | Lyso | Other | |||||||||||
| Expt C |
10 peptides |
62 spectra |
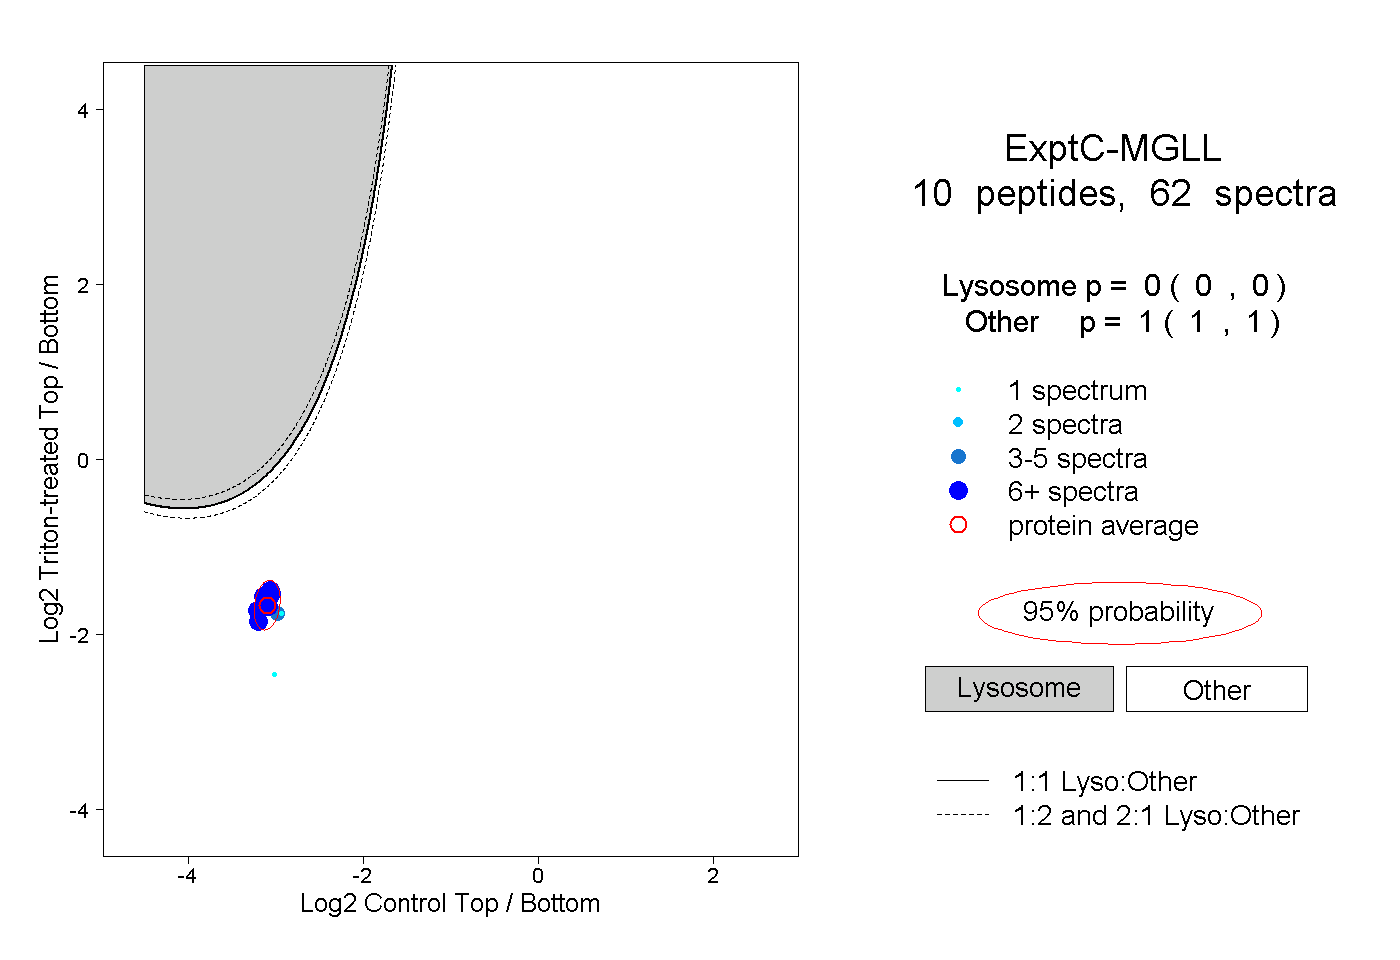 |
0.000 0.000 | 0.000 |
1.000 1.000 | 1.000 |
||||||||
| Plot | Lyso | Other | |||||||||||
| Expt D |
1 peptide |
1 spectrum |
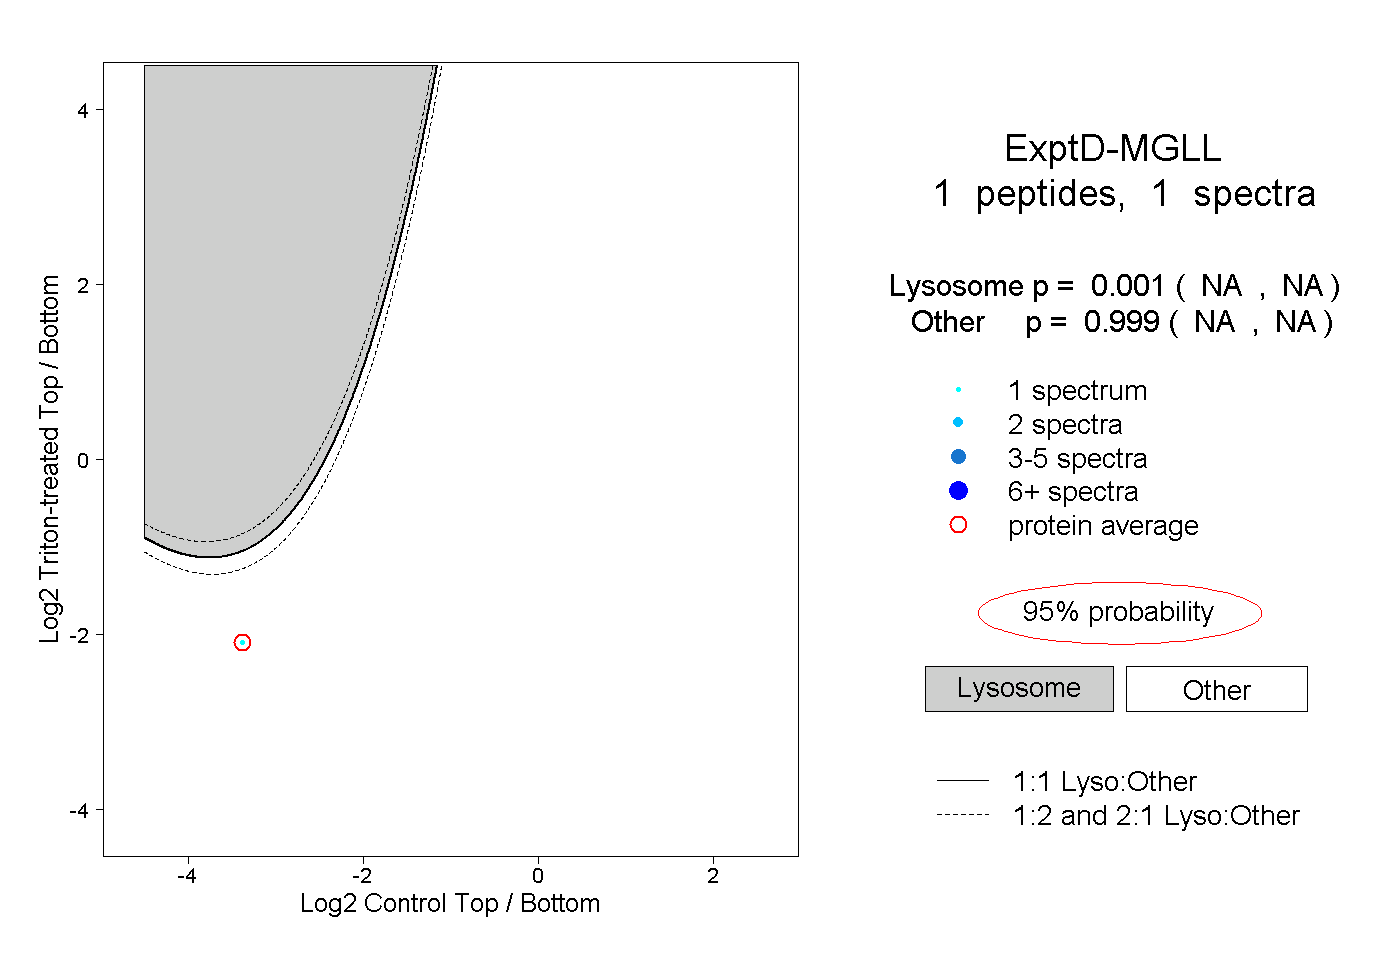 |
0.001 NA | NA |
0.999 NA | NA |