 7
7peptides
spectra
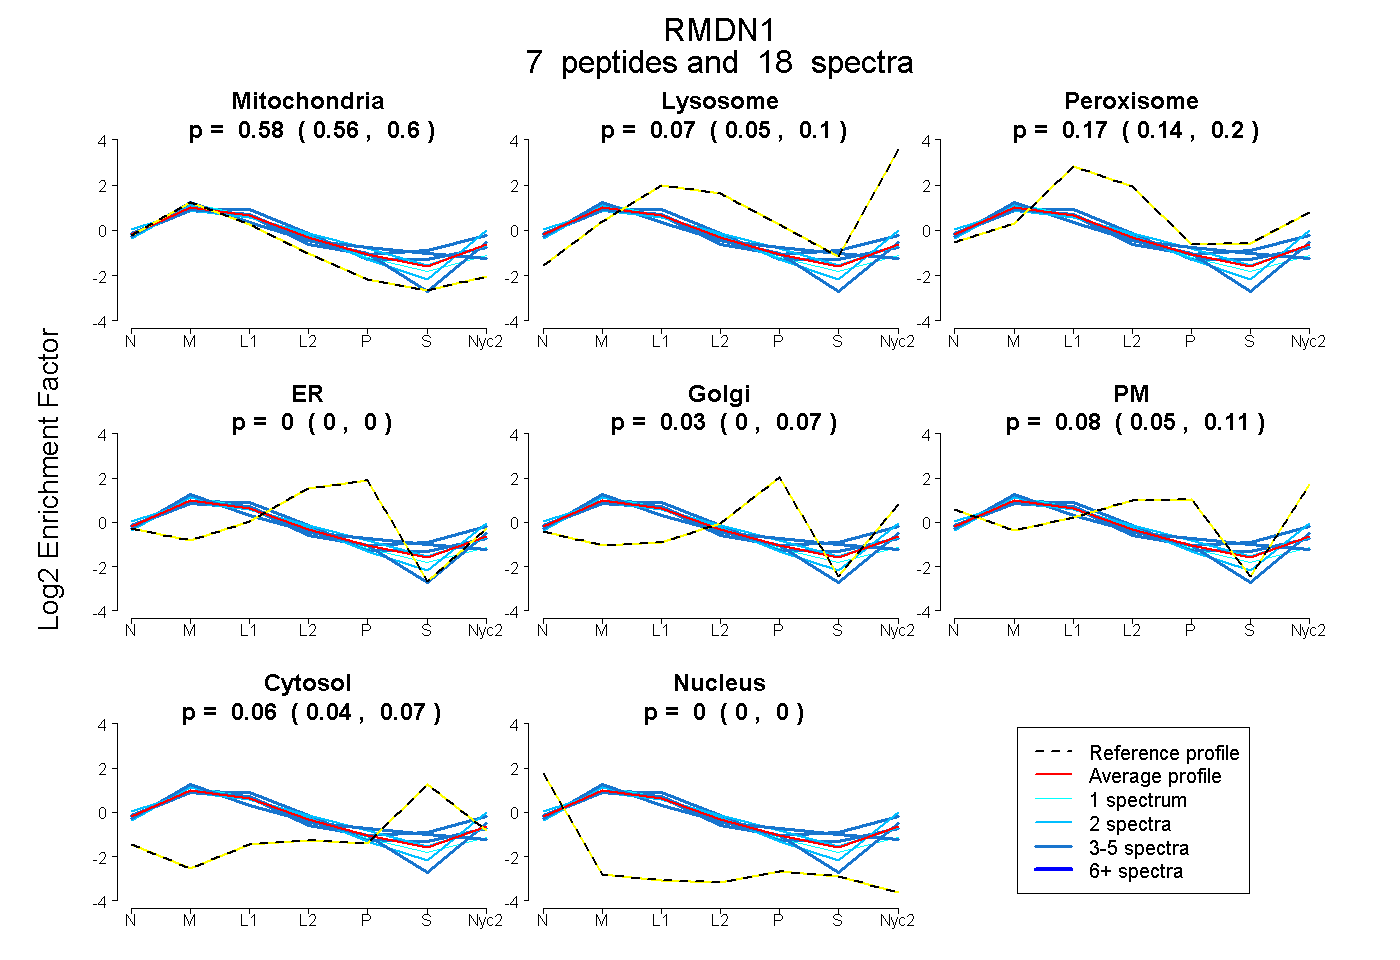
0.564 | 0.596
0.051 | 0.095
0.140 | 0.202
0.000 | 0.000
0.000 | 0.066
0.048 | 0.109
0.036 | 0.072
0.000 | 0.000
4peptides
spectra
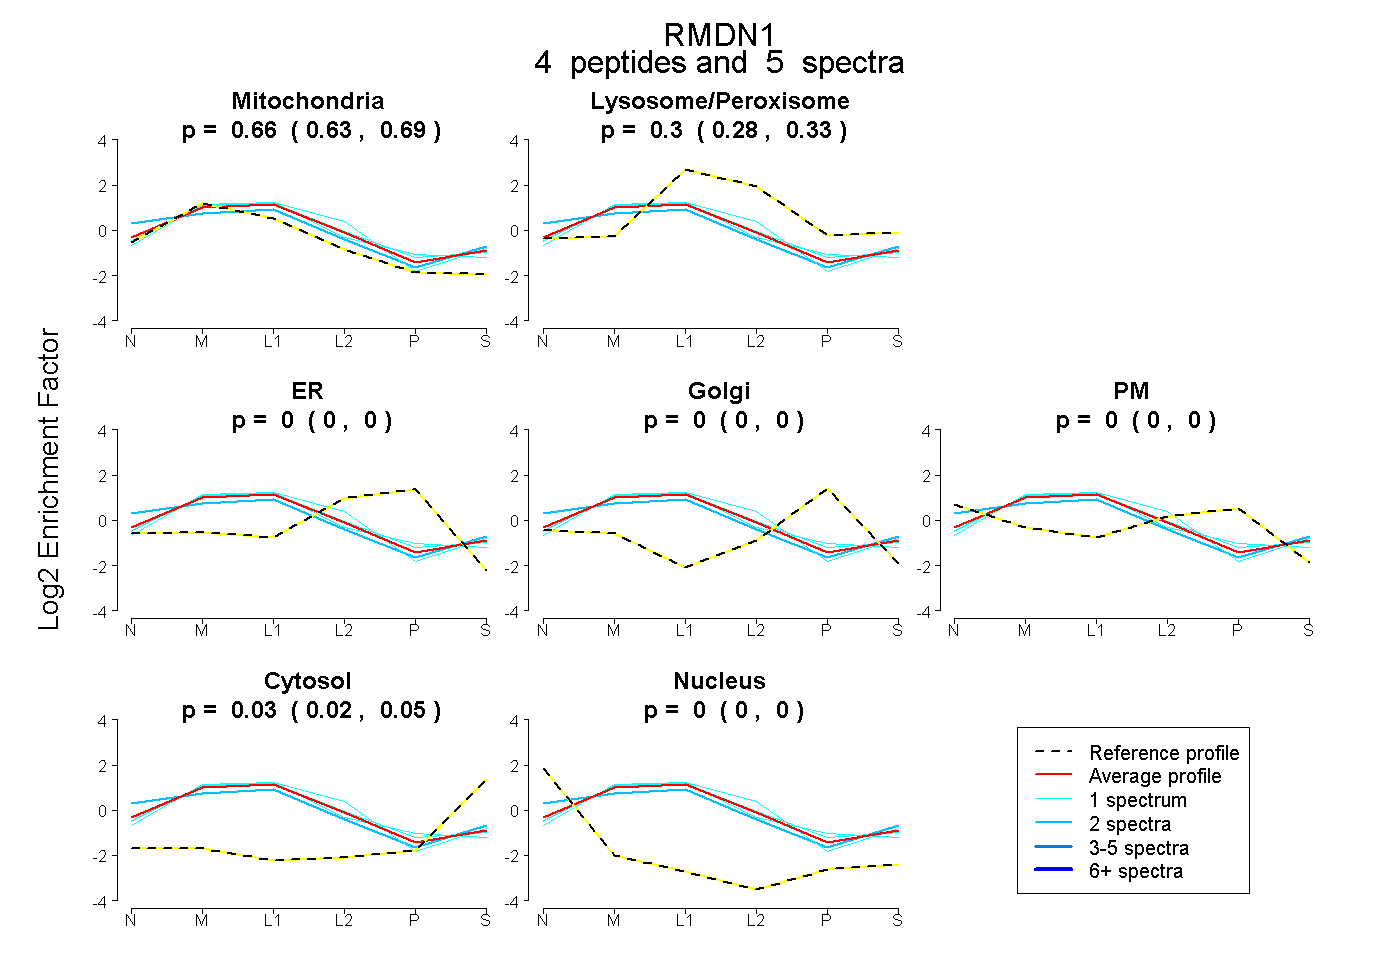
0.633 | 0.687
0.276 | 0.327
0.000 | 0.000
0.000 | 0.000
0.000 | 0.000
0.015 | 0.049
0.000 | 0.000
12peptides
spectra
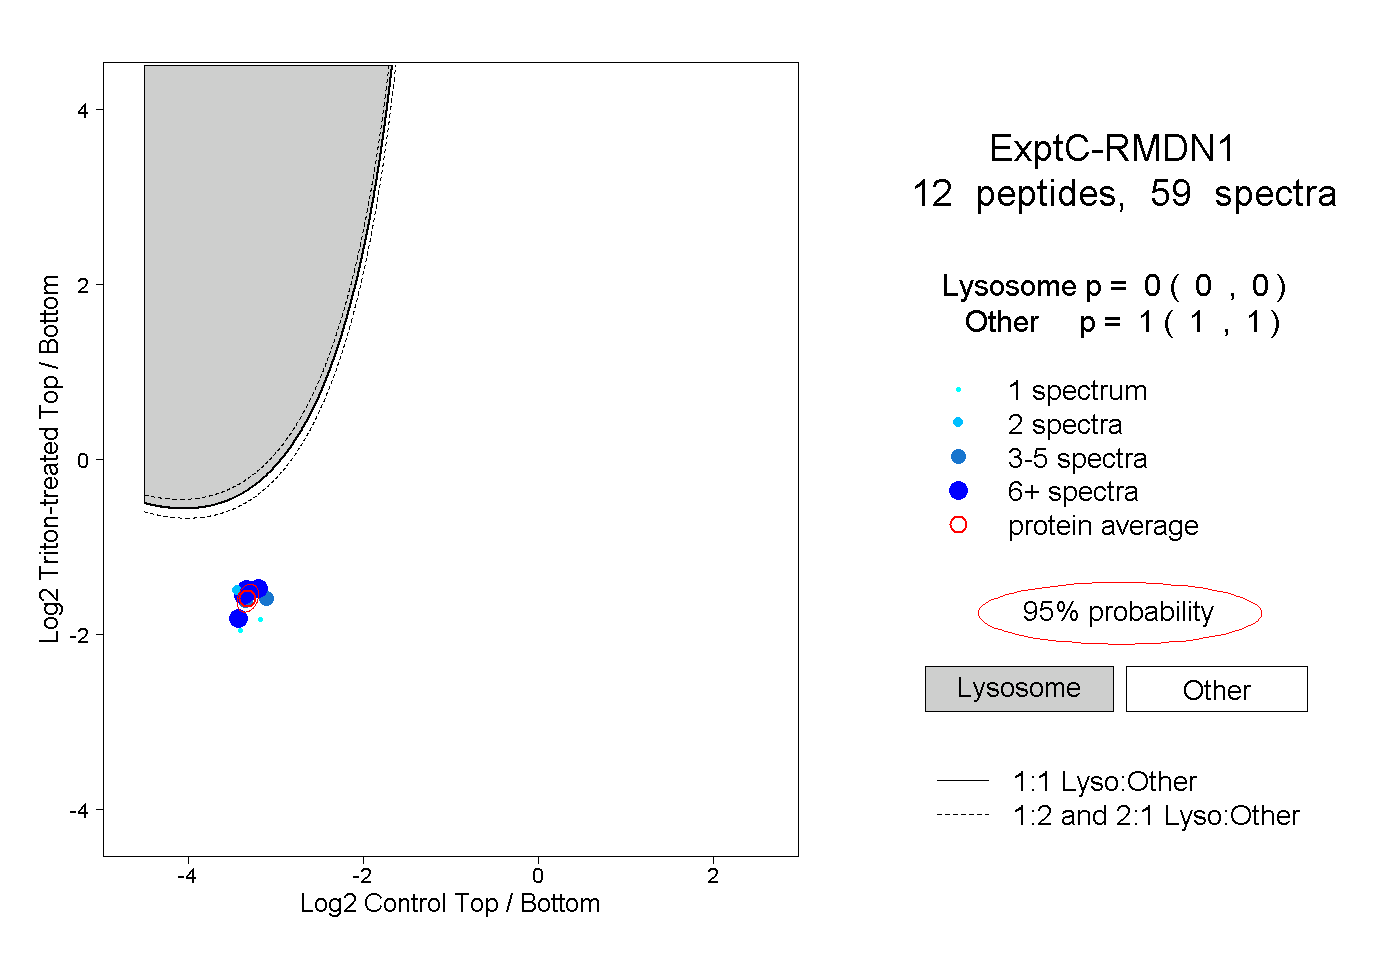
0.000 | 0.000
1.000 | 1.000
2peptides
spectra
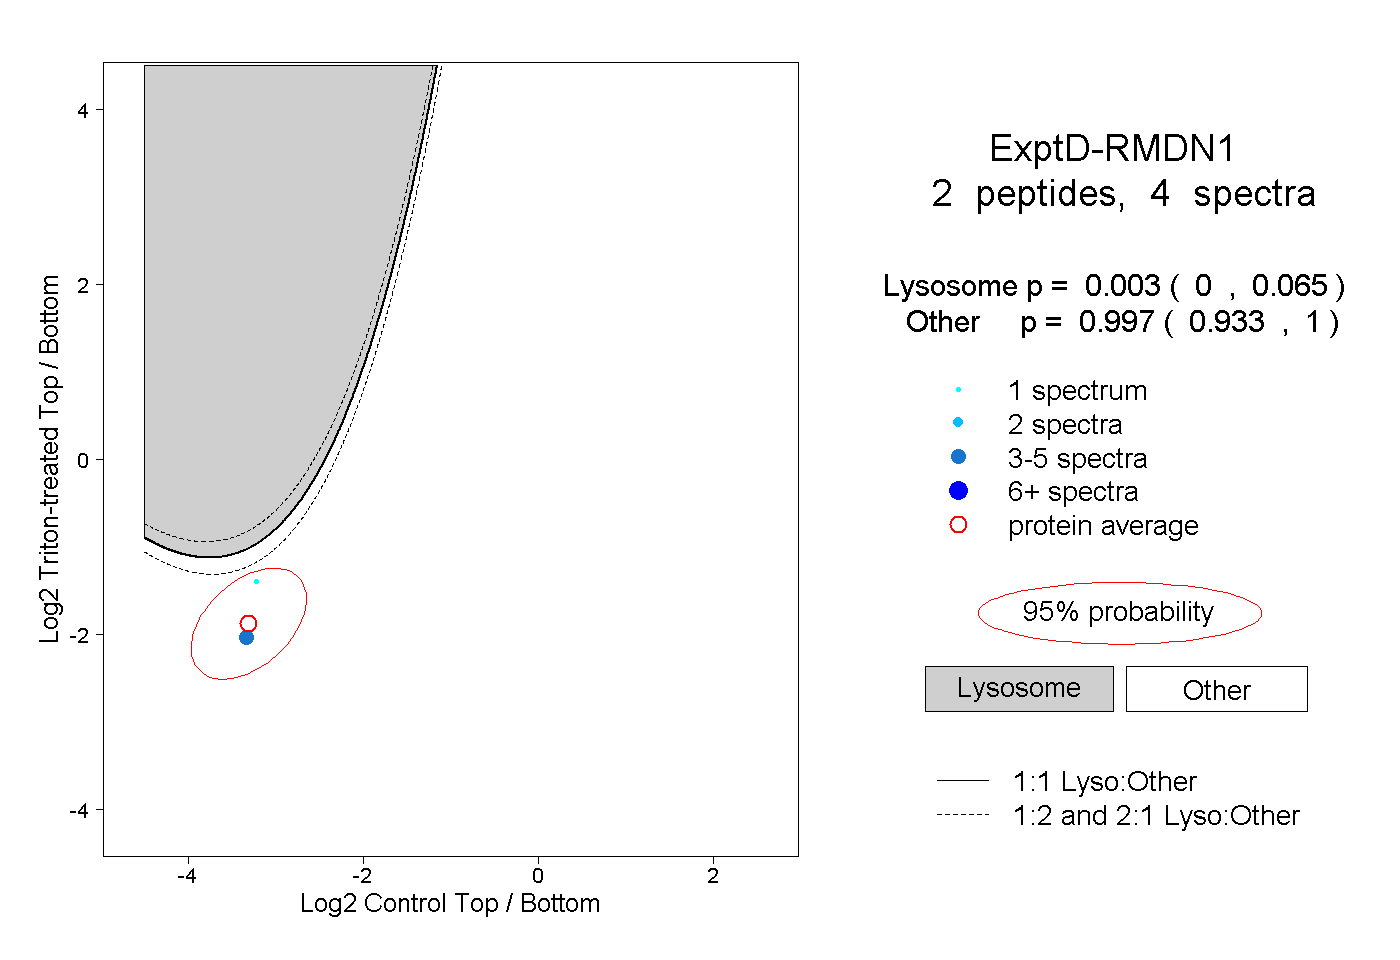
0.000 | 0.065
0.933 | 1.000