 7
7peptides
spectra
0.564 | 0.596
0.051 | 0.095
0.140 | 0.202
0.000 | 0.000
0.000 | 0.066
0.048 | 0.109
0.036 | 0.072
0.000 | 0.000
| Plot | Mito | Lyso | Perox | ER | Golgi | PM | Cytosol | Nucleus | |||||
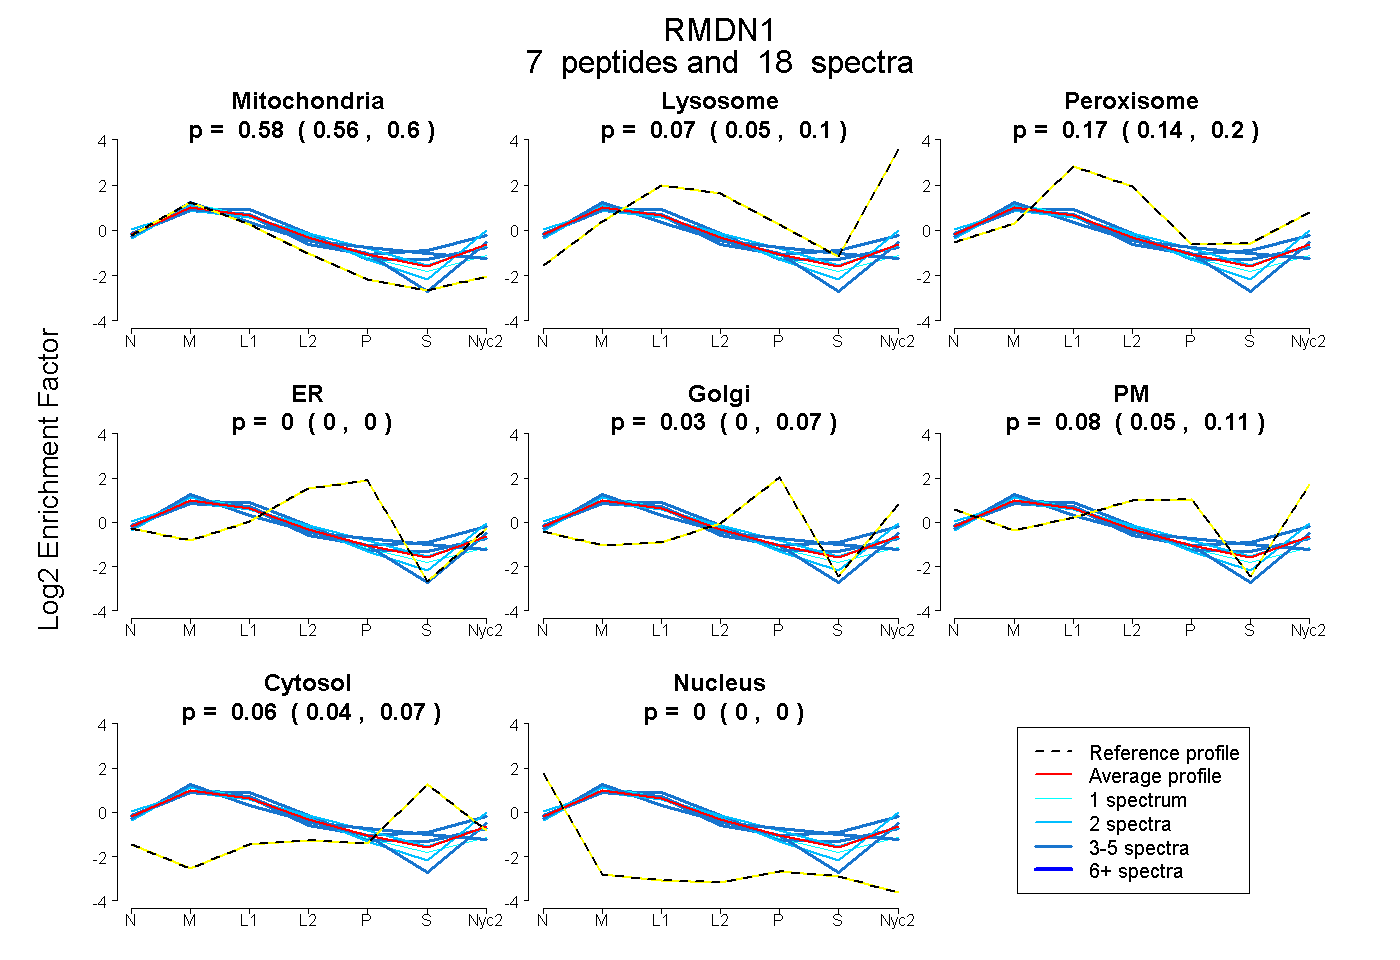
| Expt A |
7 peptides |
18 spectra |
|
0.581 0.564 | 0.596 |
0.075 0.051 | 0.095 |
0.172 0.140 | 0.202 |
0.000 0.000 | 0.000 |
0.033 0.000 | 0.066 |
0.083 0.048 | 0.109 |
0.056 0.036 | 0.072 |
0.000 0.000 | 0.000 |
| 3 spectra, WYAICISDVGDYEGIK | 0.533 | 0.000 | 0.268 | 0.000 | 0.082 | 0.000 | 0.116 | 0.000 | ||
| 2 spectra, LYQLLTQYK | 0.642 | 0.272 | 0.000 | 0.000 | 0.000 | 0.086 | 0.000 | 0.000 | ||
| 3 spectra, AEEVDPNFYSK | 0.497 | 0.172 | 0.133 | 0.000 | 0.000 | 0.039 | 0.159 | 0.000 | ||
| 2 spectra, VLLYEALEYAK | 0.519 | 0.000 | 0.213 | 0.000 | 0.042 | 0.170 | 0.055 | 0.000 | ||
| 3 spectra, NLLILGK | 0.678 | 0.109 | 0.000 | 0.000 | 0.022 | 0.192 | 0.000 | 0.000 | ||
| 1 spectrum, LAAFWLVK | 0.658 | 0.000 | 0.247 | 0.000 | 0.094 | 0.000 | 0.001 | 0.000 | ||
| 4 spectra, ESEDVELLWR | 0.540 | 0.005 | 0.328 | 0.000 | 0.000 | 0.048 | 0.078 | 0.000 |
| Plot | Mito | Lyso or Perox | ER | Golgi | PM | Cytosol | Nucleus | ||||||
| Expt B |
4 peptides |
5 spectra |
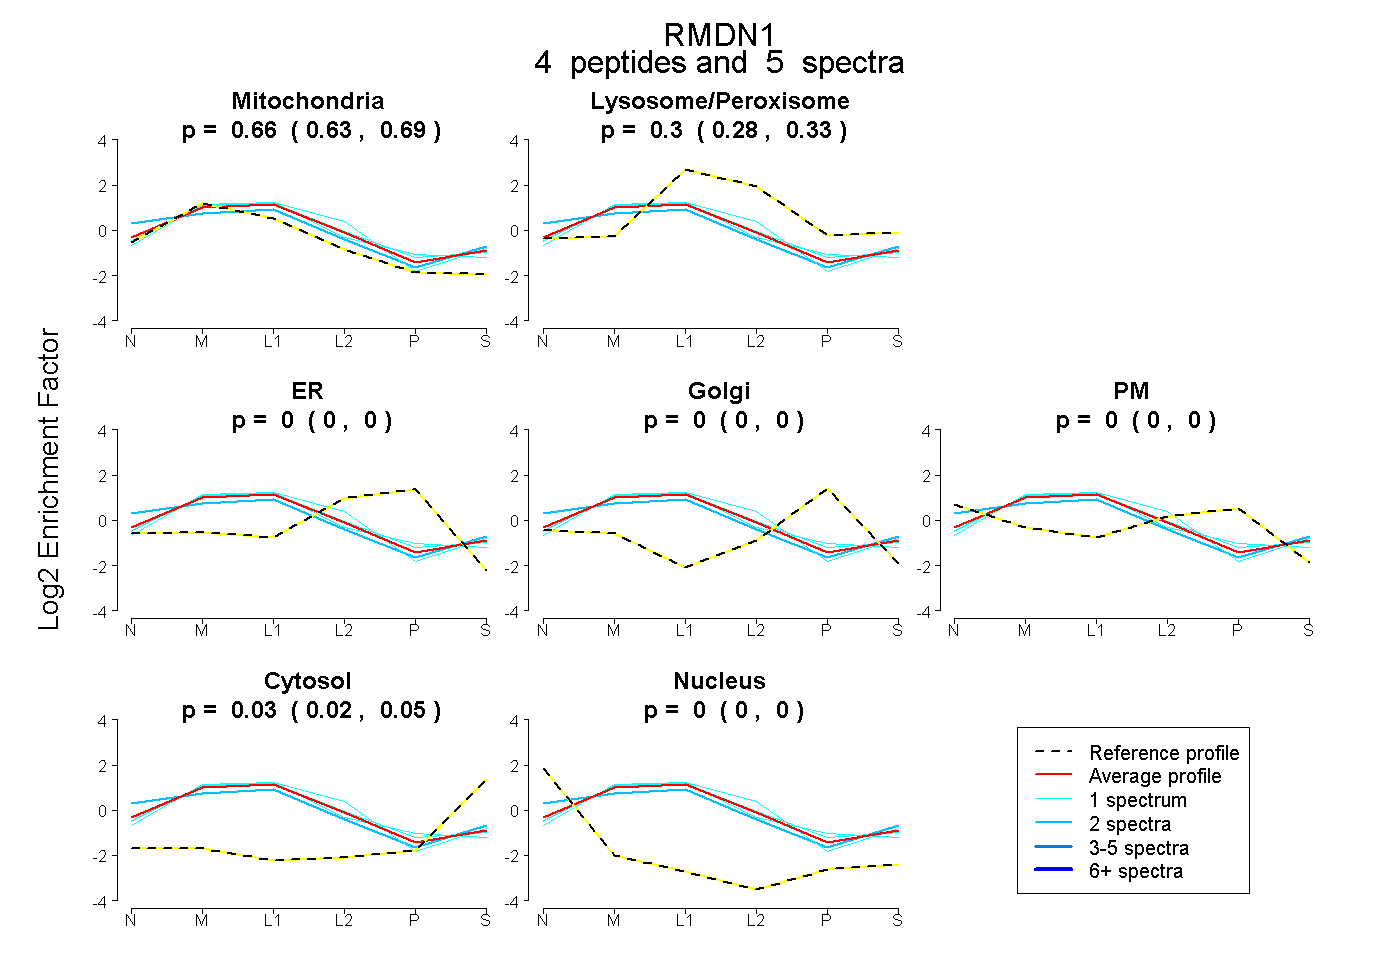 |
0.663 0.633 | 0.687 |
0.304 0.276 | 0.327 |
0.000 0.000 | 0.000 |
0.000 0.000 | 0.000 |
0.000 0.000 | 0.000 |
0.033 0.015 | 0.049 |
0.000 0.000 | 0.000 |
|||
| Plot | Lyso | Other | |||||||||||
| Expt C |
12 peptides |
59 spectra |
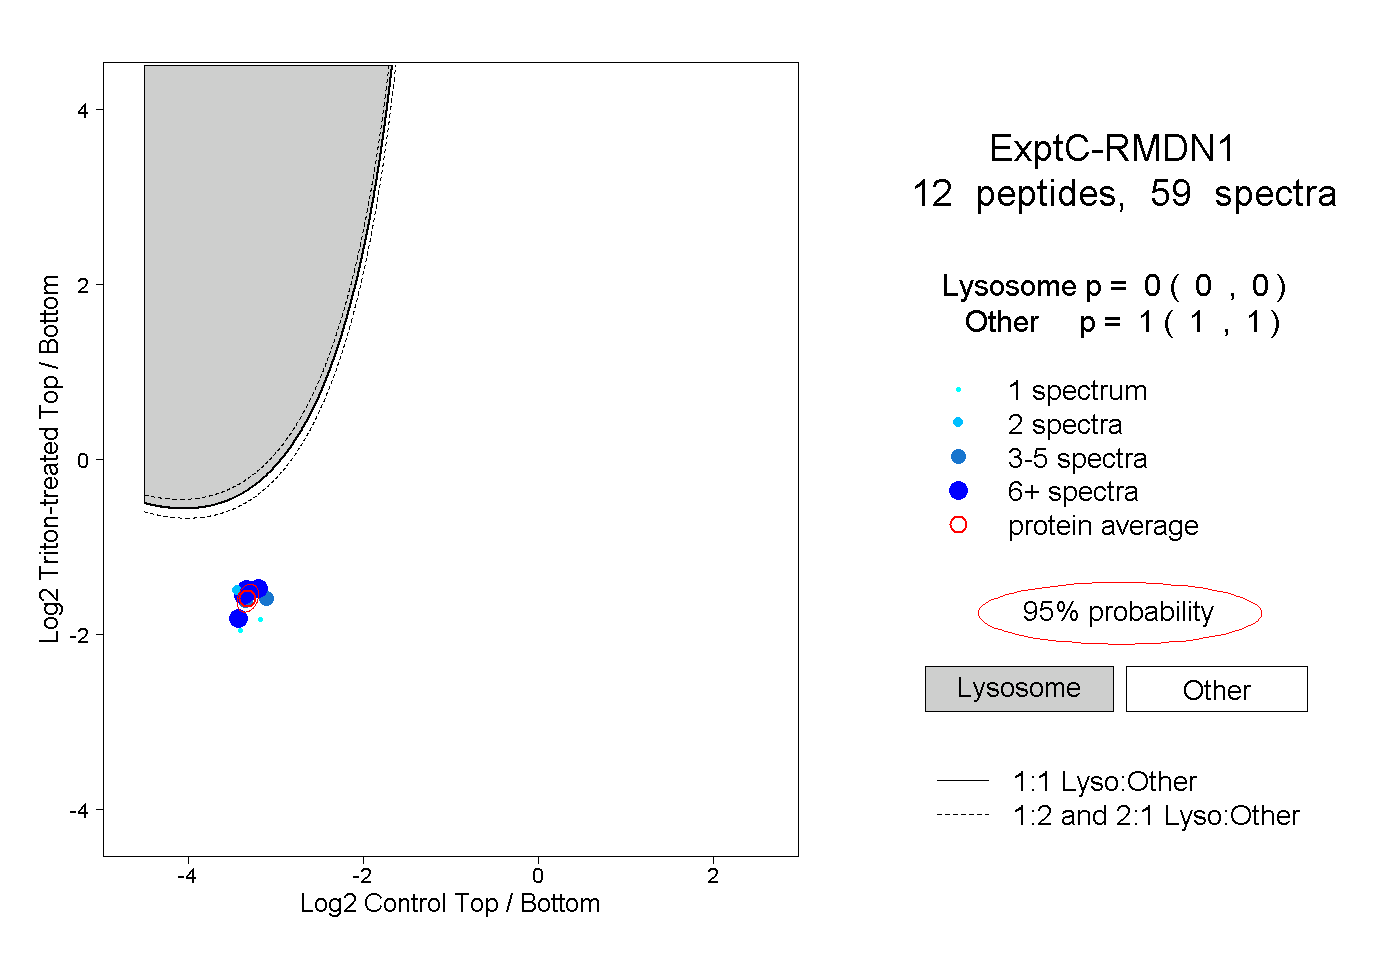 |
0.000 0.000 | 0.000 |
1.000 1.000 | 1.000 |
||||||||
| Plot | Lyso | Other | |||||||||||
| Expt D |
2 peptides |
4 spectra |
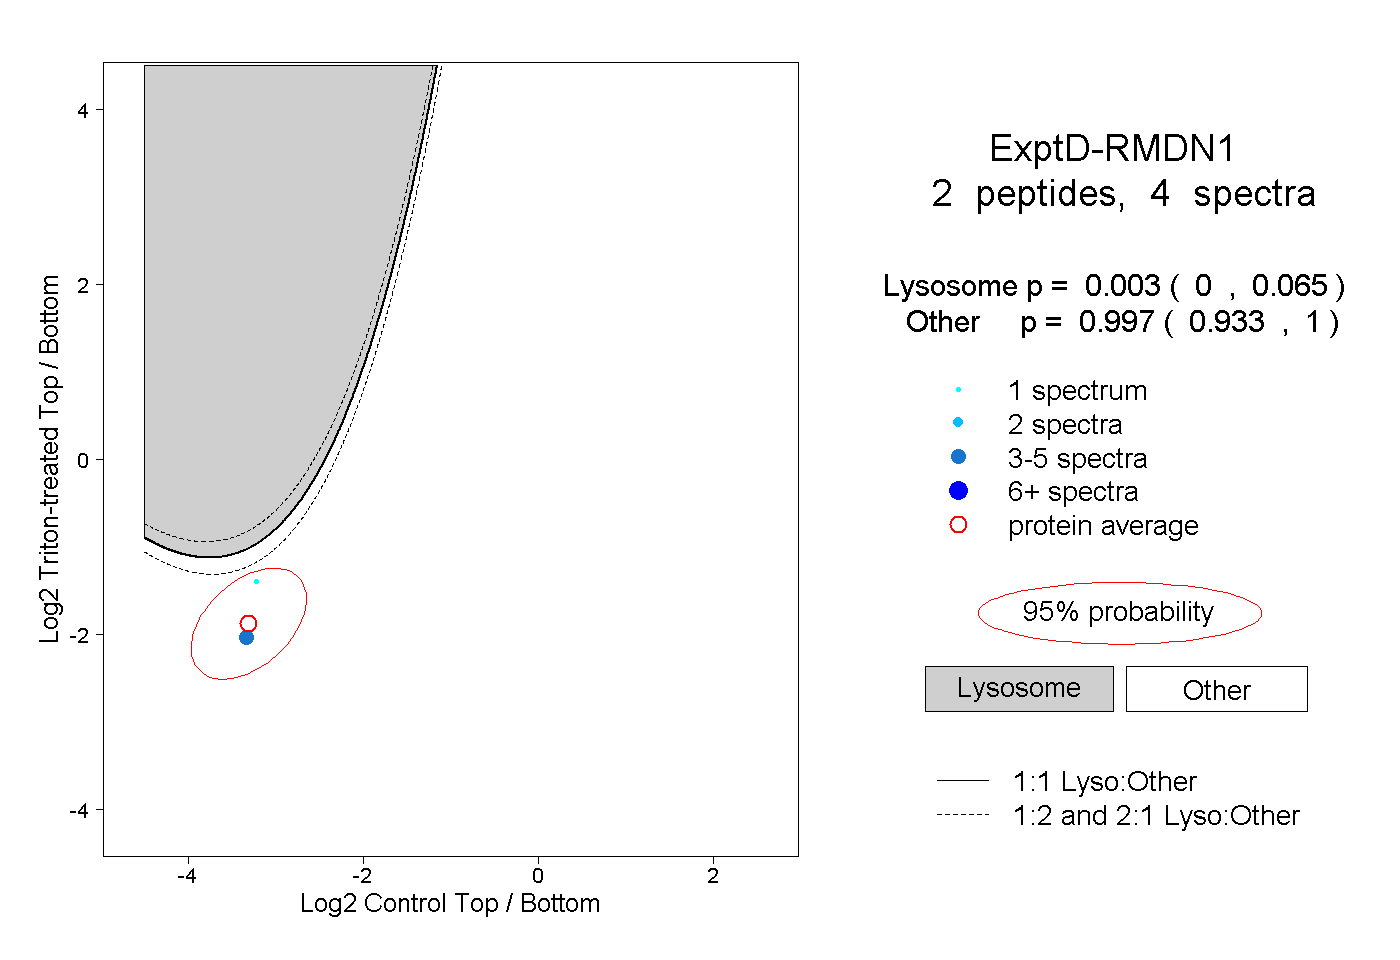 |
0.003 0.000 | 0.065 |
0.997 0.933 | 1.000 |