 10
10peptides
spectra
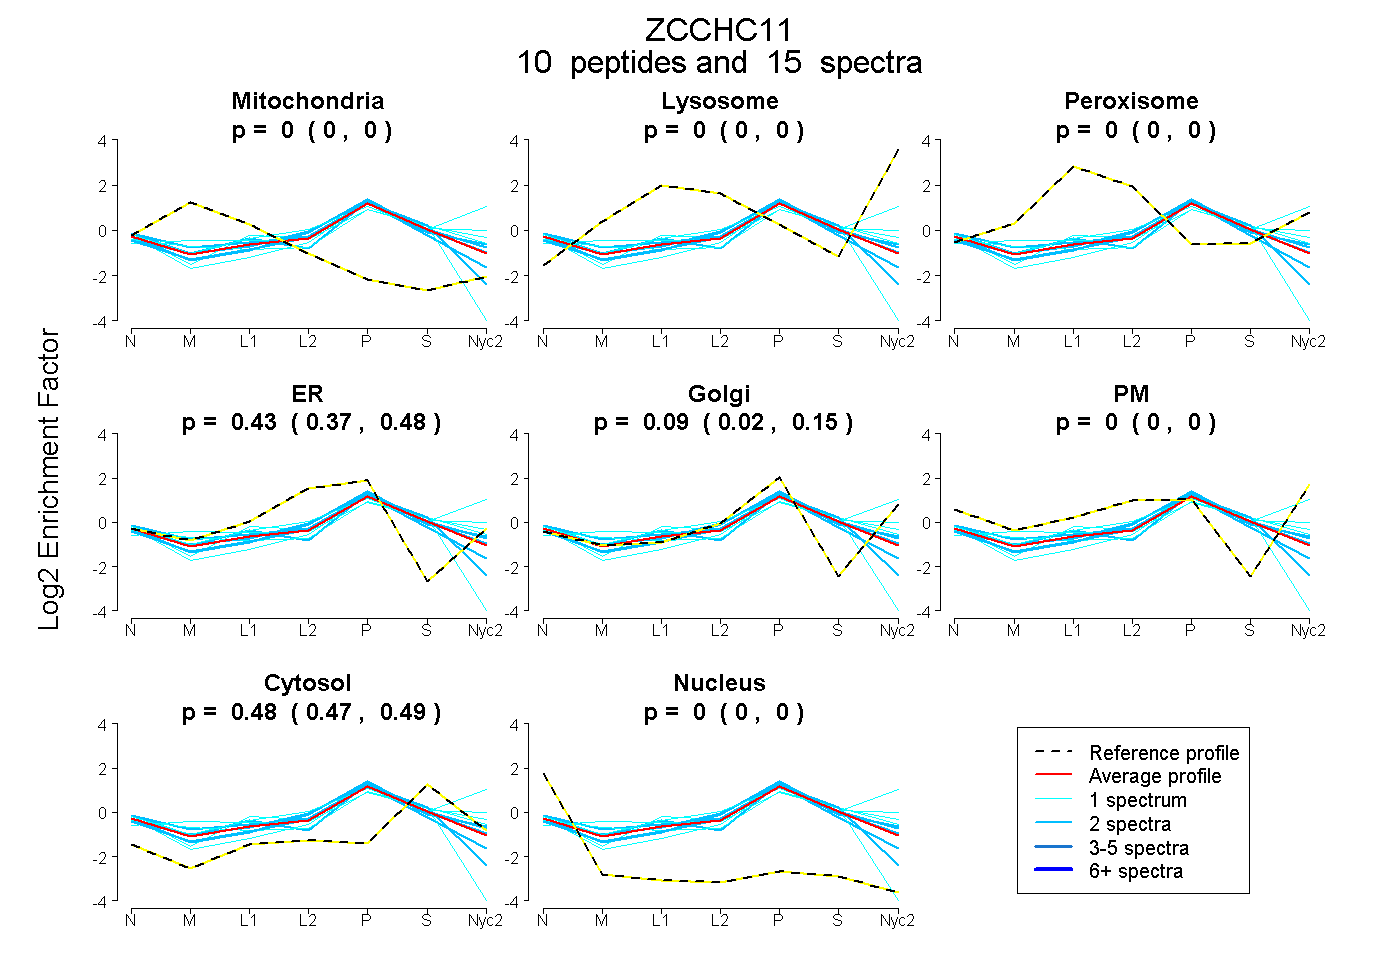
0.000 | 0.002
0.000 | 0.000
0.000 | 0.000
0.367 | 0.479
0.016 | 0.148
0.000 | 0.000
0.466 | 0.492
0.000 | 0.000
2peptides
spectra
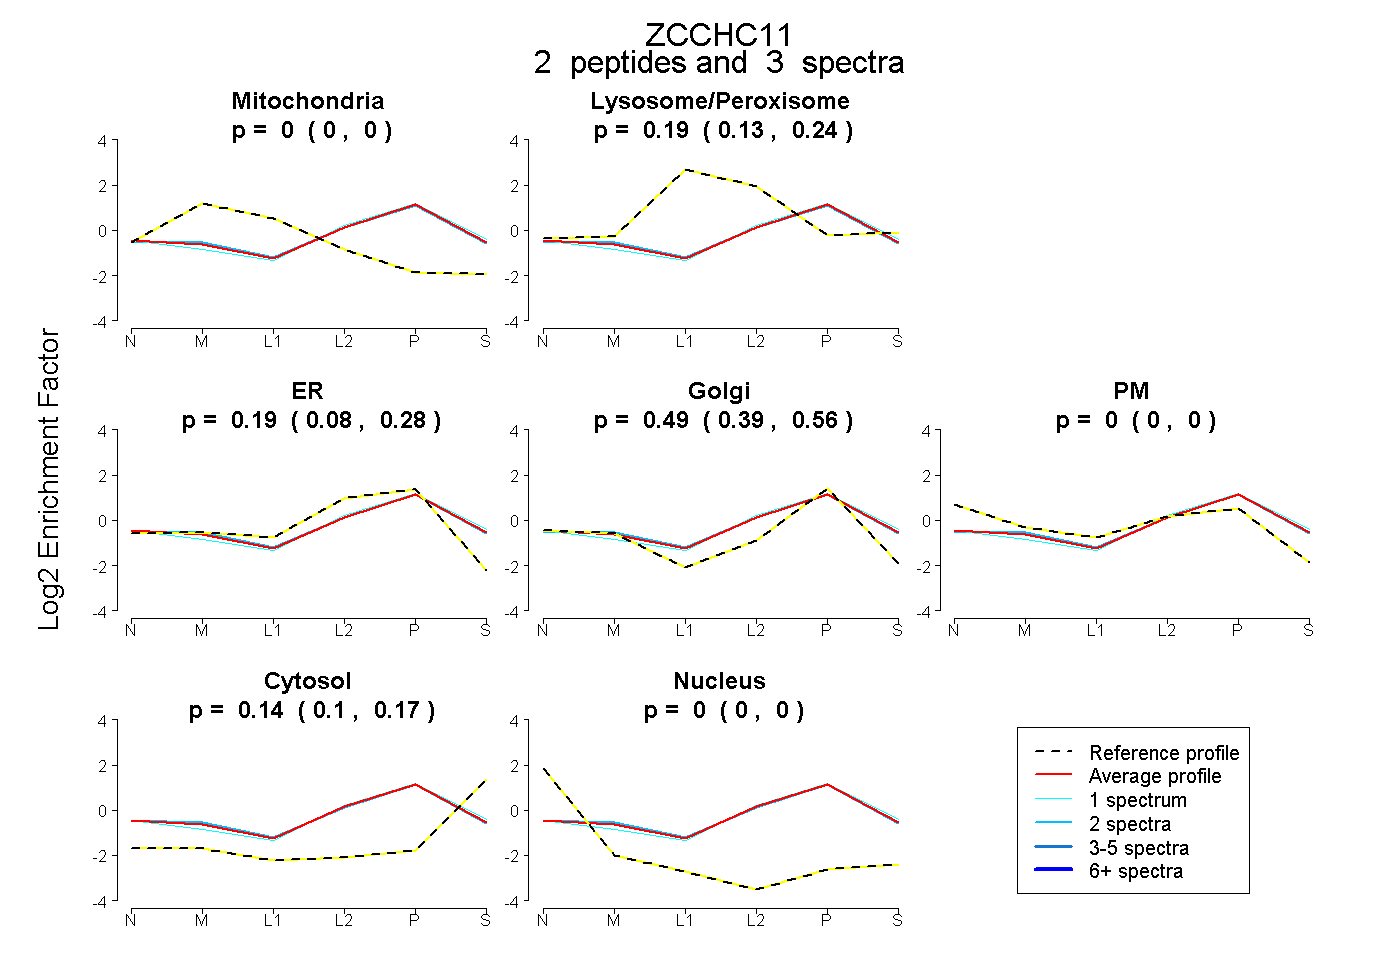
0.000 | 0.000
0.126 | 0.238
0.078 | 0.281
0.394 | 0.561
0.000 | 0.000
0.103 | 0.168
0.000 | 0.000
5peptides
spectra
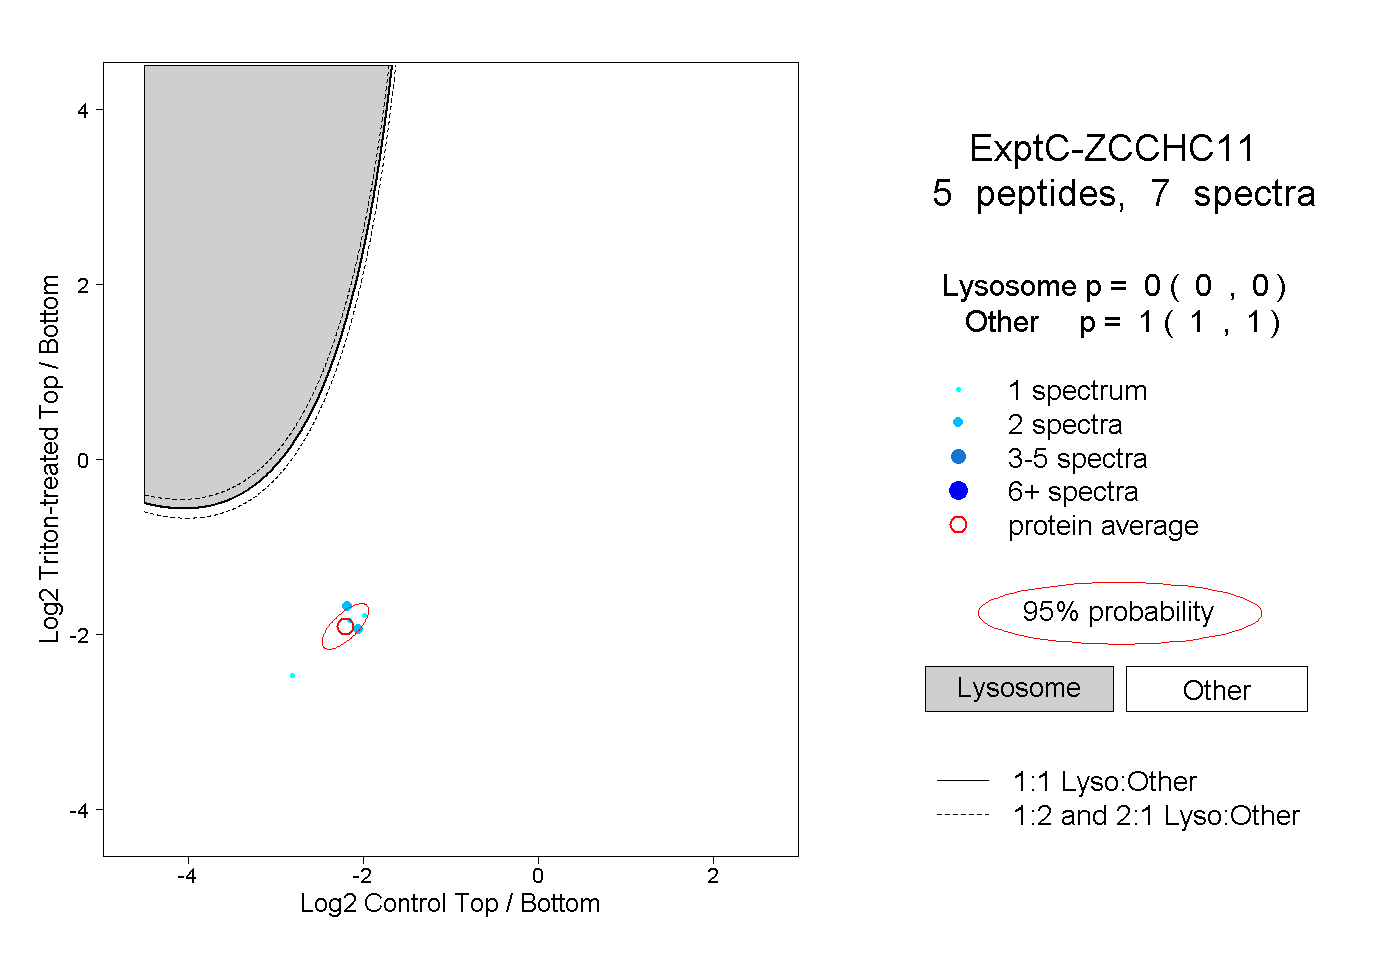
0.000 | 0.000
1.000 | 1.000
3peptides
spectra
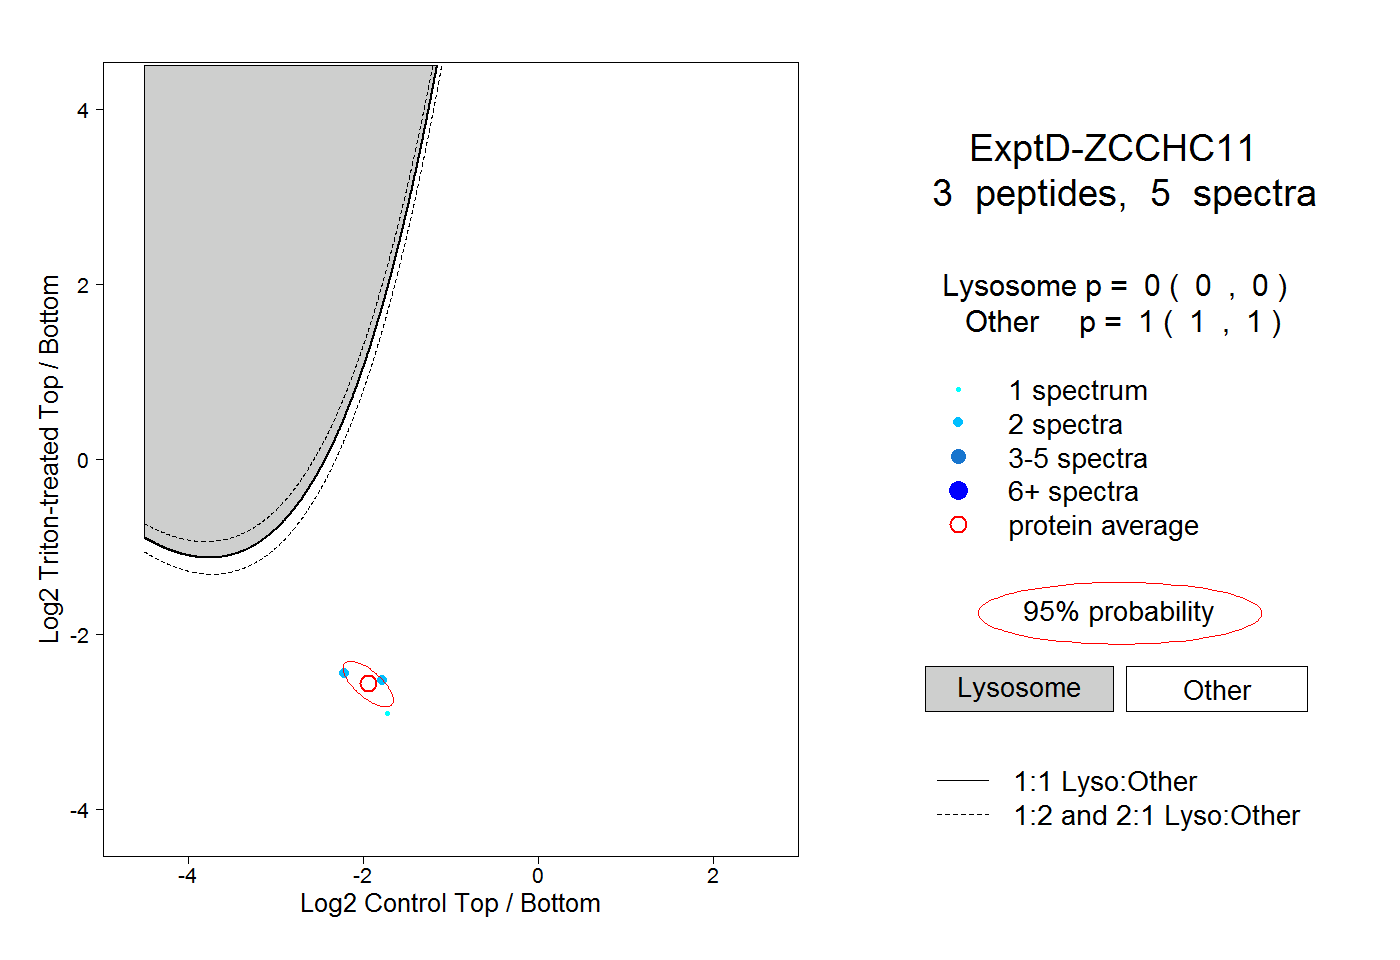
0.000 | 0.000
1.000 | 1.000