 10
10peptides
spectra
0.000 | 0.002
0.000 | 0.000
0.000 | 0.000
0.367 | 0.479
0.016 | 0.148
0.000 | 0.000
0.466 | 0.492
0.000 | 0.000
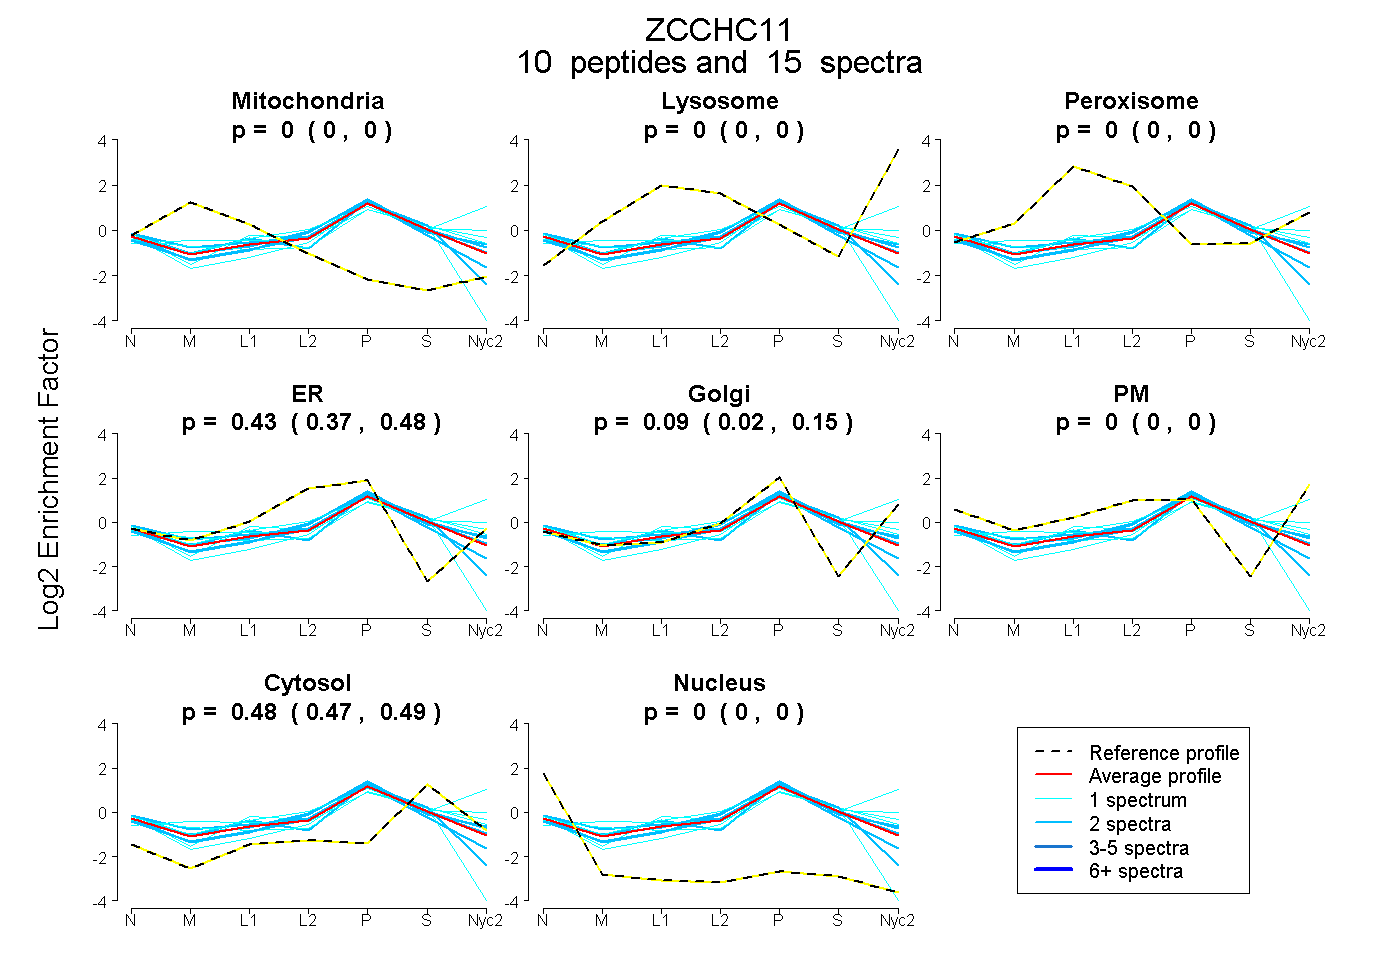
| Plot | Mito | Lyso | Perox | ER | Golgi | PM | Cytosol | Nucleus | |||||
| Expt A |
10 peptides |
15 spectra |
|
0.000 0.000 | 0.002 |
0.000 0.000 | 0.000 |
0.000 0.000 | 0.000 |
0.429 0.367 | 0.479 |
0.090 0.016 | 0.148 |
0.000 0.000 | 0.000 |
0.481 0.466 | 0.492 |
0.000 0.000 | 0.000 |
| 1 spectrum, EILDLVCK | 0.024 | 0.000 | 0.184 | 0.000 | 0.412 | 0.000 | 0.380 | 0.000 | ||
| 2 spectra, EQGITDDDLR | 0.000 | 0.000 | 0.000 | 0.427 | 0.116 | 0.000 | 0.457 | 0.000 | ||
| 2 spectra, IDLKPLPPMTNR | 0.000 | 0.000 | 0.002 | 0.437 | 0.115 | 0.000 | 0.446 | 0.000 | ||
| 1 spectrum, SGLLCR | 0.000 | 0.000 | 0.178 | 0.095 | 0.371 | 0.000 | 0.355 | 0.000 | ||
| 2 spectra, DLLDSR | 0.018 | 0.000 | 0.062 | 0.121 | 0.402 | 0.000 | 0.396 | 0.000 | ||
| 2 spectra, EAEYFFDSR | 0.067 | 0.000 | 0.000 | 0.514 | 0.000 | 0.000 | 0.400 | 0.019 | ||
| 2 spectra, LCLFGSSK | 0.000 | 0.000 | 0.000 | 0.445 | 0.000 | 0.000 | 0.487 | 0.068 | ||
| 1 spectrum, FILTSGKPPTIVCSICK | 0.000 | 0.000 | 0.000 | 0.362 | 0.000 | 0.000 | 0.414 | 0.224 | ||
| 1 spectrum, CIVDNDR | 0.000 | 0.144 | 0.000 | 0.000 | 0.359 | 0.142 | 0.355 | 0.000 | ||
| 1 spectrum, IQDILTR | 0.049 | 0.000 | 0.063 | 0.029 | 0.415 | 0.000 | 0.444 | 0.000 |
| Plot | Mito | Lyso or Perox | ER | Golgi | PM | Cytosol | Nucleus | ||||||
| Expt B |
2 peptides |
3 spectra |
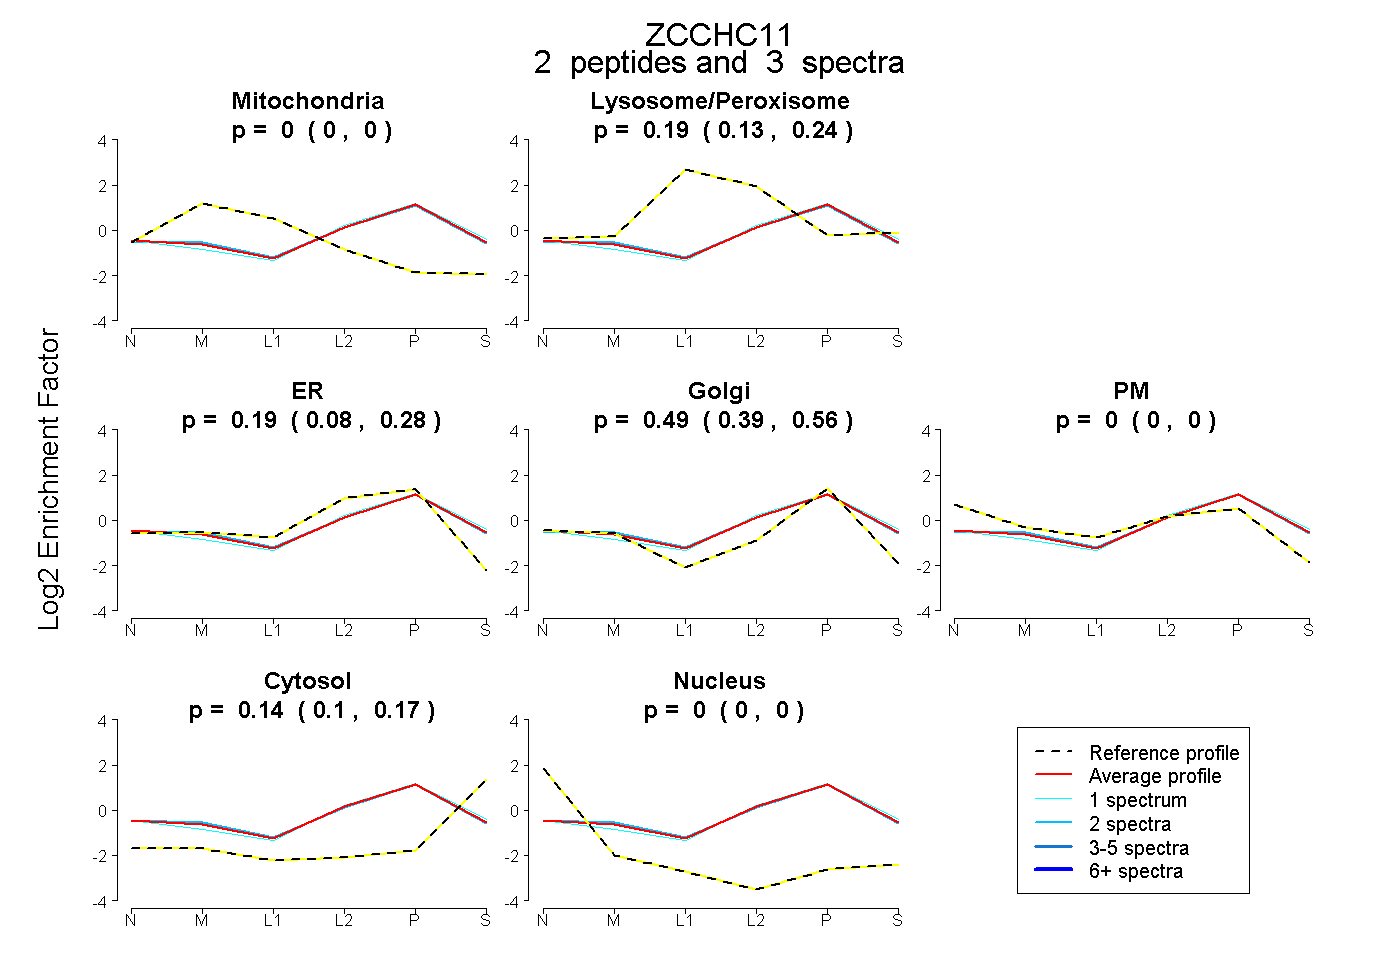 |
0.000 0.000 | 0.000 |
0.186 0.126 | 0.238 |
0.189 0.078 | 0.281 |
0.486 0.394 | 0.561 |
0.000 0.000 | 0.000 |
0.139 0.103 | 0.168 |
0.000 0.000 | 0.000 |
|||
| Plot | Lyso | Other | |||||||||||
| Expt C |
5 peptides |
7 spectra |
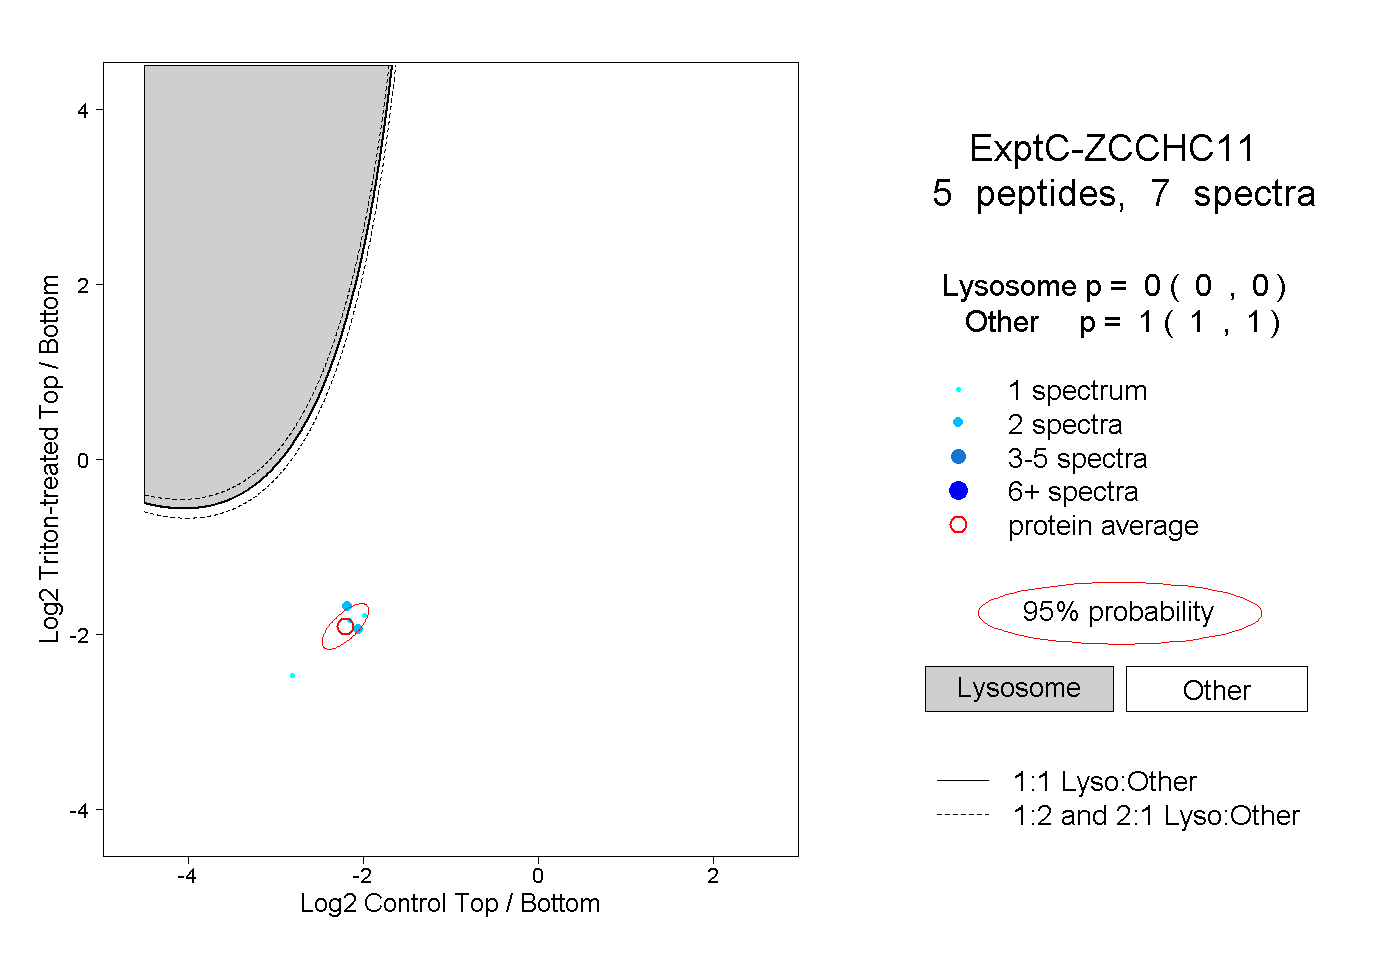 |
0.000 0.000 | 0.000 |
1.000 1.000 | 1.000 |
||||||||
| Plot | Lyso | Other | |||||||||||
| Expt D |
3 peptides |
5 spectra |
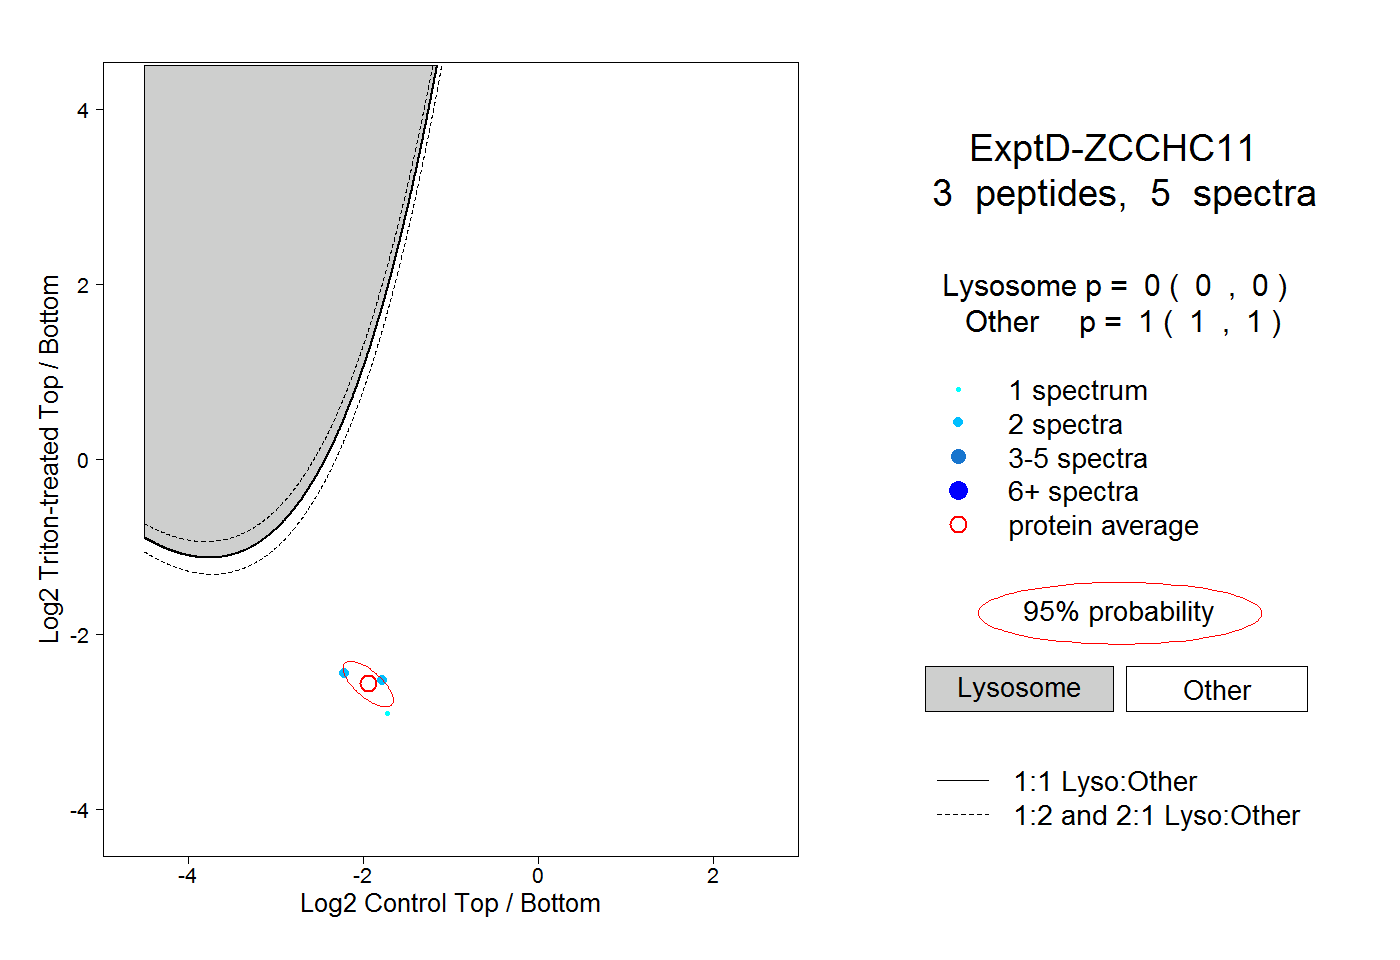 |
0.000 0.000 | 0.000 |
1.000 1.000 | 1.000 |