 9
9peptides
spectra
0.000 | 0.000
0.021 | 0.057
0.000 | 0.000
0.000 | 0.000
0.040 | 0.073
0.000 | 0.000
0.887 | 0.915
0.000 | 0.000
8peptides
spectra
0.000 | 0.000
1.000 | 1.000
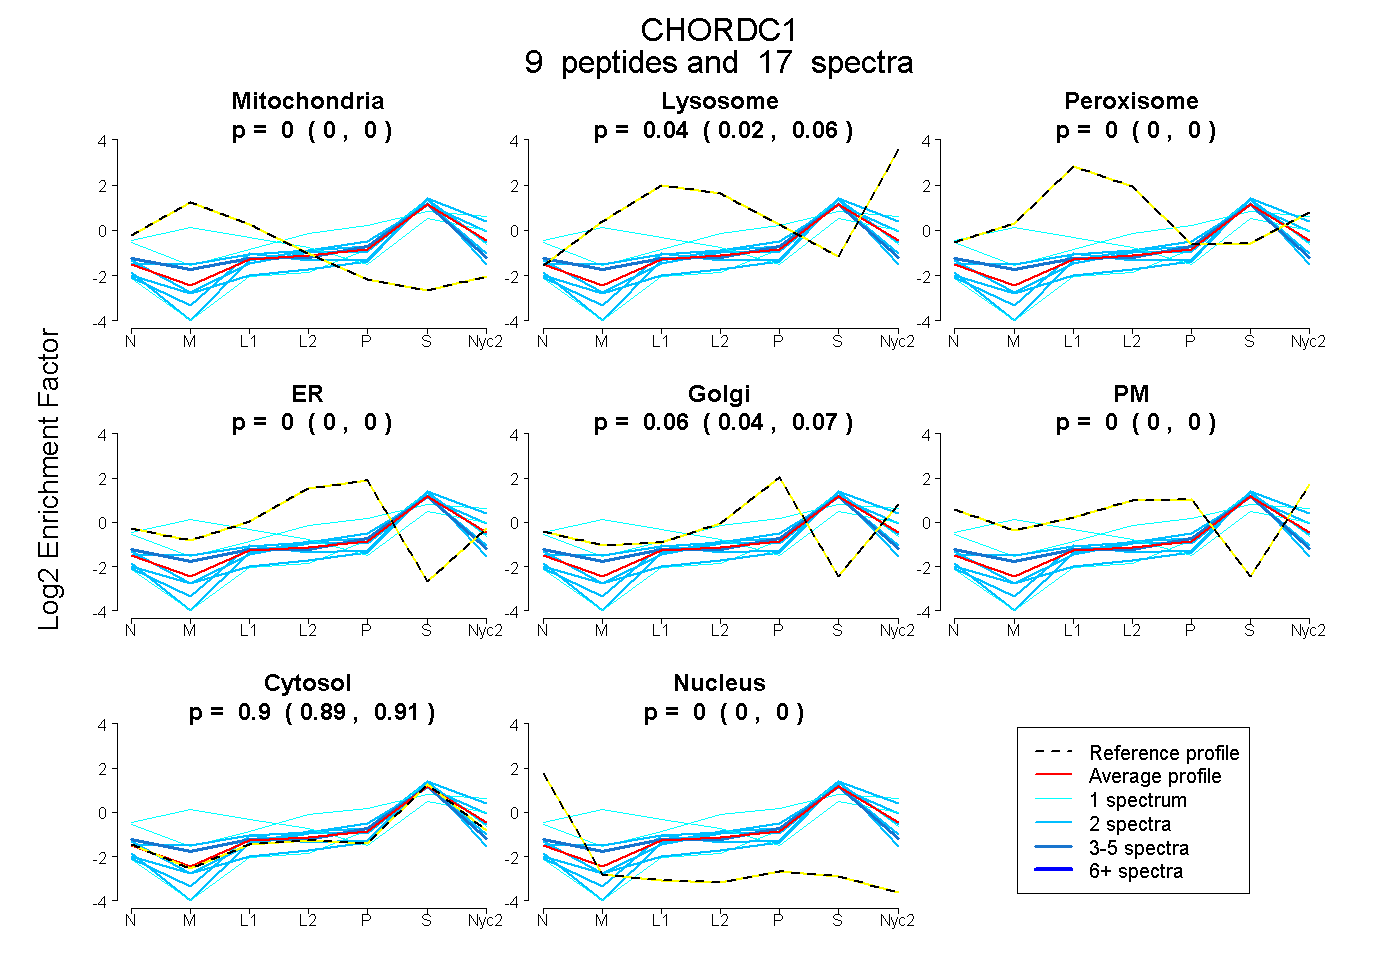
| Plot | Mito | Lyso | Perox | ER | Golgi | PM | Cytosol | Nucleus | |||||
| Expt A |
9 peptides |
17 spectra |
|
0.000 0.000 | 0.000 |
0.041 0.021 | 0.057 |
0.000 0.000 | 0.000 |
0.000 0.000 | 0.000 |
0.056 0.040 | 0.073 |
0.000 0.000 | 0.000 |
0.902 0.887 | 0.915 |
0.000 0.000 | 0.000 |
||
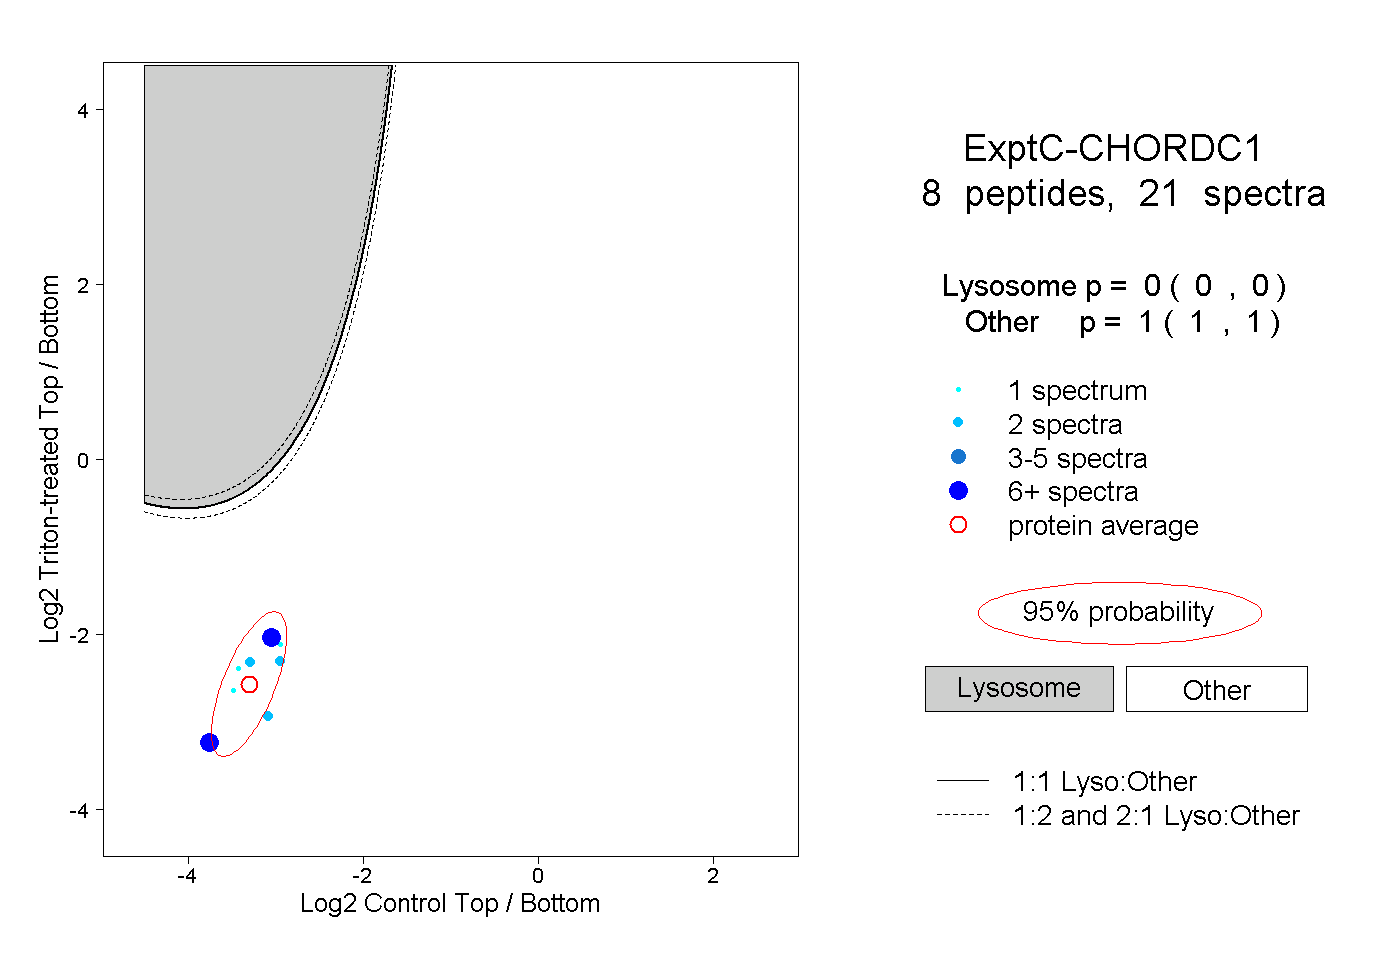
| Plot | Lyso | Other | |||||||||||
| Expt C |
8 peptides |
21 spectra |
|
0.000 0.000 | 0.000 |
1.000 1.000 | 1.000 |