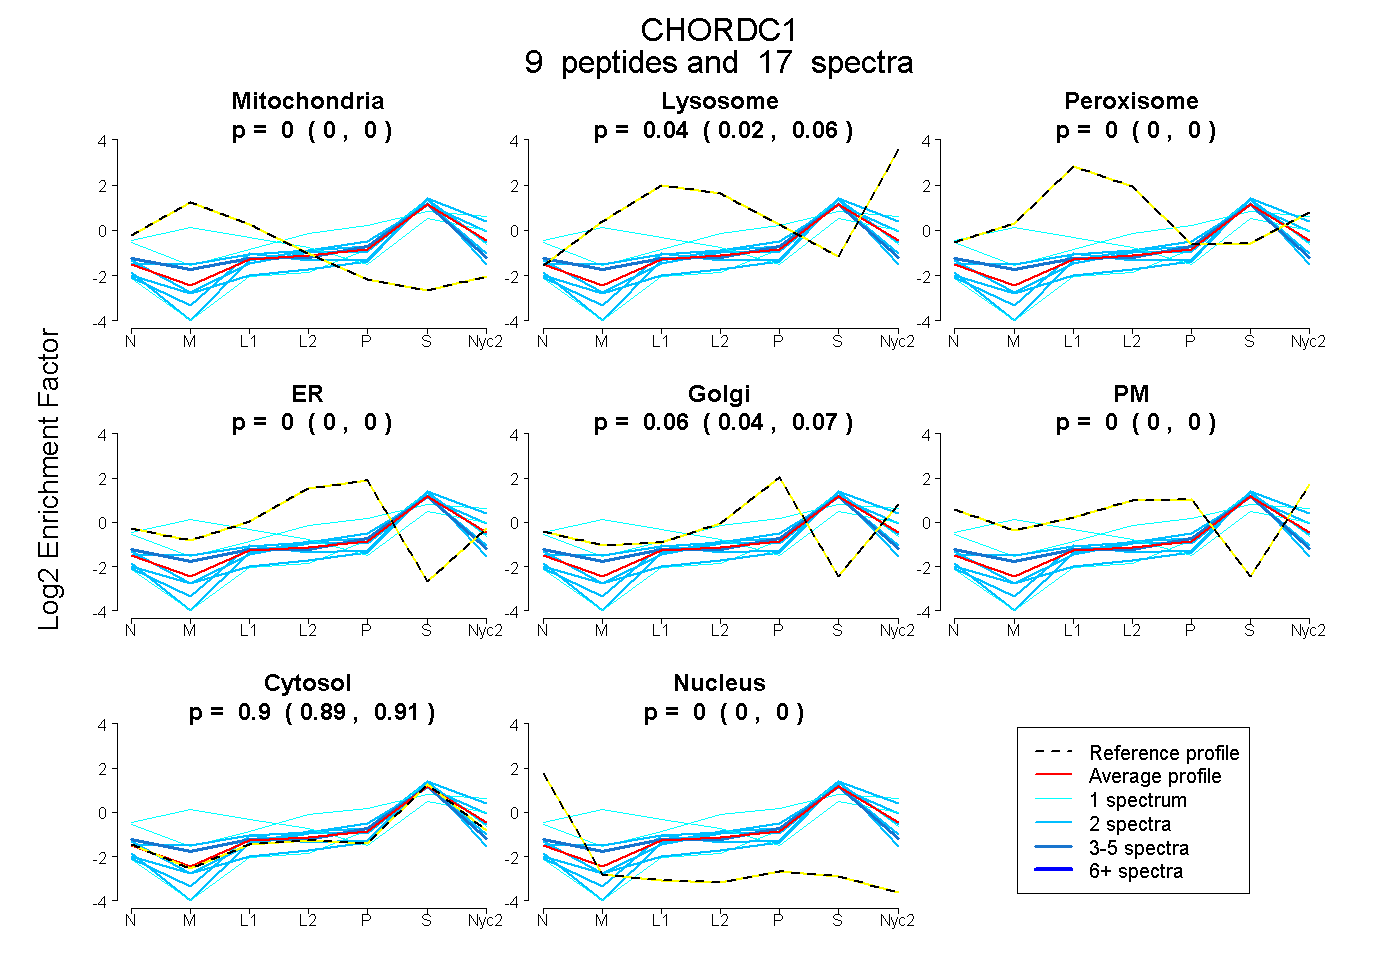
 9
9peptides
spectra
0.000 | 0.000
0.021 | 0.057
0.000 | 0.000
0.000 | 0.000
0.040 | 0.073
0.000 | 0.000
0.887 | 0.915
0.000 | 0.000
| Plot | Mito | Lyso | Perox | ER | Golgi | PM | Cytosol | Nucleus | |||||
| Expt A |
9 peptides |
17 spectra |
|
0.000 0.000 | 0.000 |
0.041 0.021 | 0.057 |
0.000 0.000 | 0.000 |
0.000 0.000 | 0.000 |
0.056 0.040 | 0.073 |
0.000 0.000 | 0.000 |
0.902 0.887 | 0.915 |
0.000 0.000 | 0.000 |
| 1 spectrum, TSDFNTFLAQEGCTR | 0.281 | 0.161 | 0.076 | 0.000 | 0.000 | 0.000 | 0.482 | 0.000 | ||
| 2 spectra, TTDFSDFLSIVGCTK | 0.000 | 0.073 | 0.000 | 0.000 | 0.000 | 0.000 | 0.927 | 0.000 | ||
| 1 spectrum, NGGCSK | 0.000 | 0.131 | 0.000 | 0.000 | 0.066 | 0.206 | 0.597 | 0.000 | ||
| 1 spectrum, IEITMR | 0.000 | 0.000 | 0.000 | 0.000 | 0.000 | 0.000 | 1.000 | 0.000 | ||
| 2 spectra, LWGVIDVK | 0.000 | 0.000 | 0.000 | 0.000 | 0.000 | 0.000 | 1.000 | 0.000 | ||
| 2 spectra, SYVTMTATK | 0.000 | 0.000 | 0.000 | 0.054 | 0.000 | 0.000 | 0.946 | 0.000 | ||
| 2 spectra, RPSPDEPMTNLELK | 0.000 | 0.152 | 0.000 | 0.000 | 0.069 | 0.000 | 0.779 | 0.000 | ||
| 2 spectra, GWSCCK | 0.000 | 0.000 | 0.000 | 0.000 | 0.000 | 0.000 | 1.000 | 0.000 | ||
| 4 spectra, YWSCCR | 0.060 | 0.000 | 0.000 | 0.076 | 0.000 | 0.000 | 0.865 | 0.000 |
| Plot | Lyso | Other | |||||||||||
| Expt C |
8 peptides |
21 spectra |
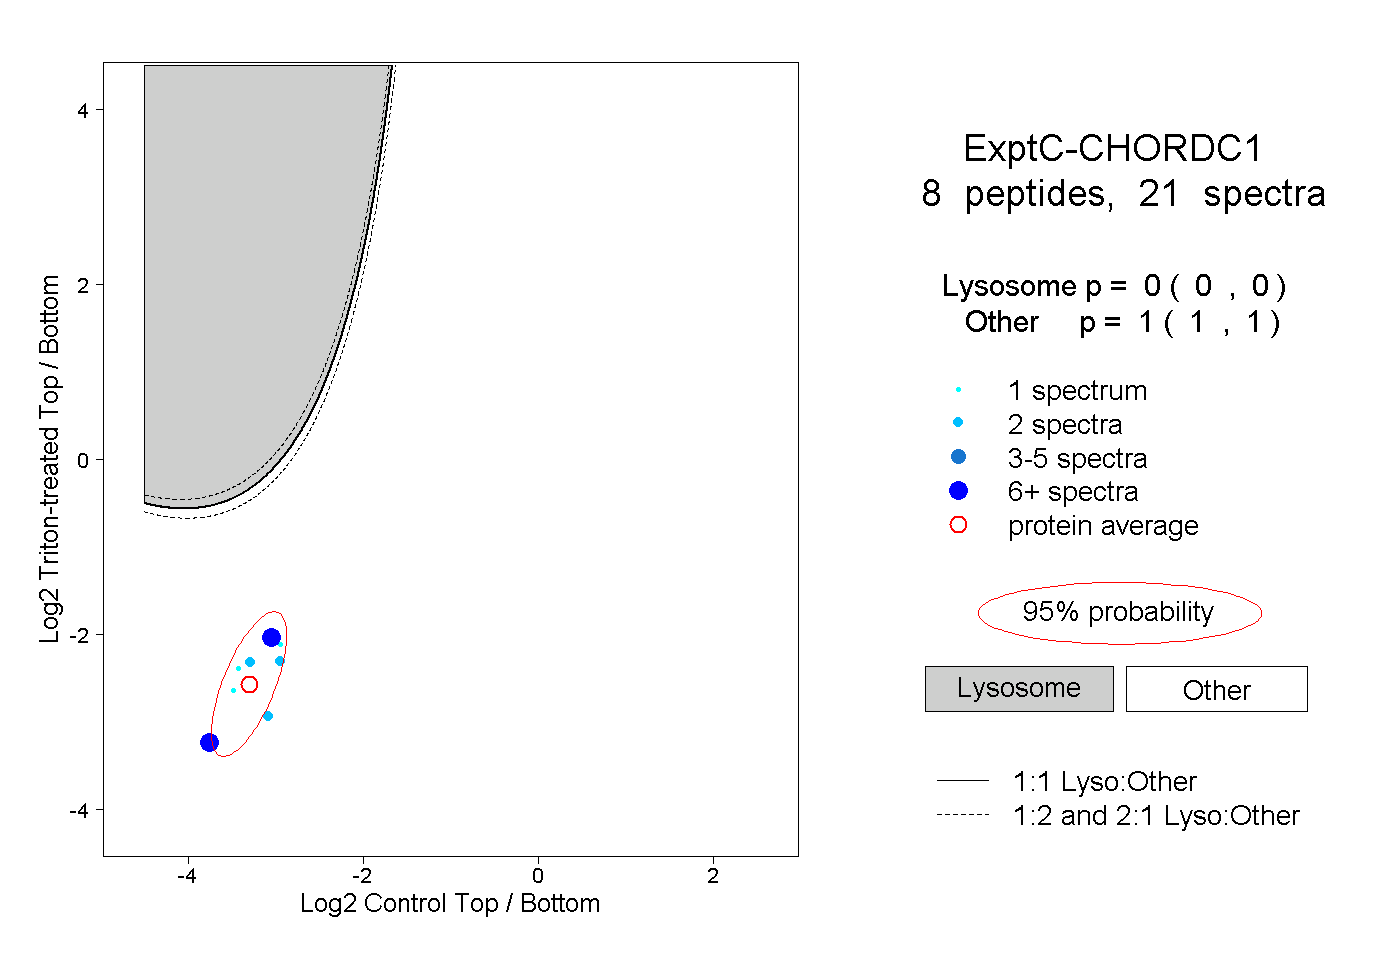 |
0.000 0.000 | 0.000 |
1.000 1.000 | 1.000 |