 9
9peptides
spectra
0.000 | 0.000
0.071 | 0.097
0.097 | 0.131
0.000 | 0.000
0.498 | 0.538
0.047 | 0.088
0.203 | 0.218
0.000 | 0.000
4peptides
spectra
0.000 | 0.000
1.000 | 1.000
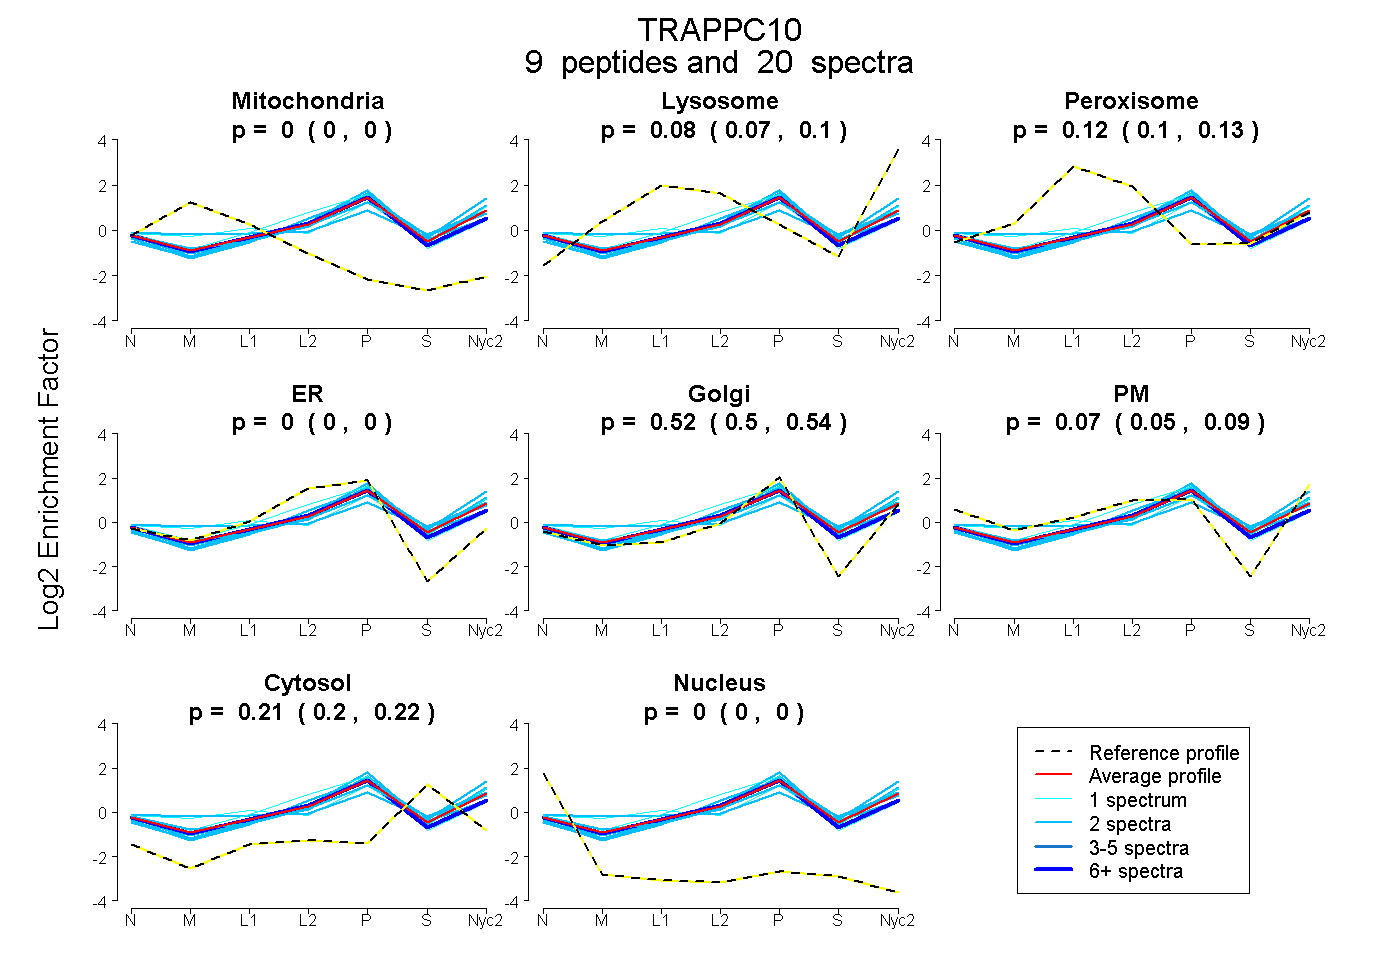
| Plot | Mito | Lyso | Perox | ER | Golgi | PM | Cytosol | Nucleus | |||||
| Expt A |
9 peptides |
20 spectra |
|
0.000 0.000 | 0.000 |
0.085 0.071 | 0.097 |
0.115 0.097 | 0.131 |
0.000 0.000 | 0.000 |
0.519 0.498 | 0.538 |
0.070 0.047 | 0.088 |
0.212 0.203 | 0.218 |
0.000 0.000 | 0.000 |
||
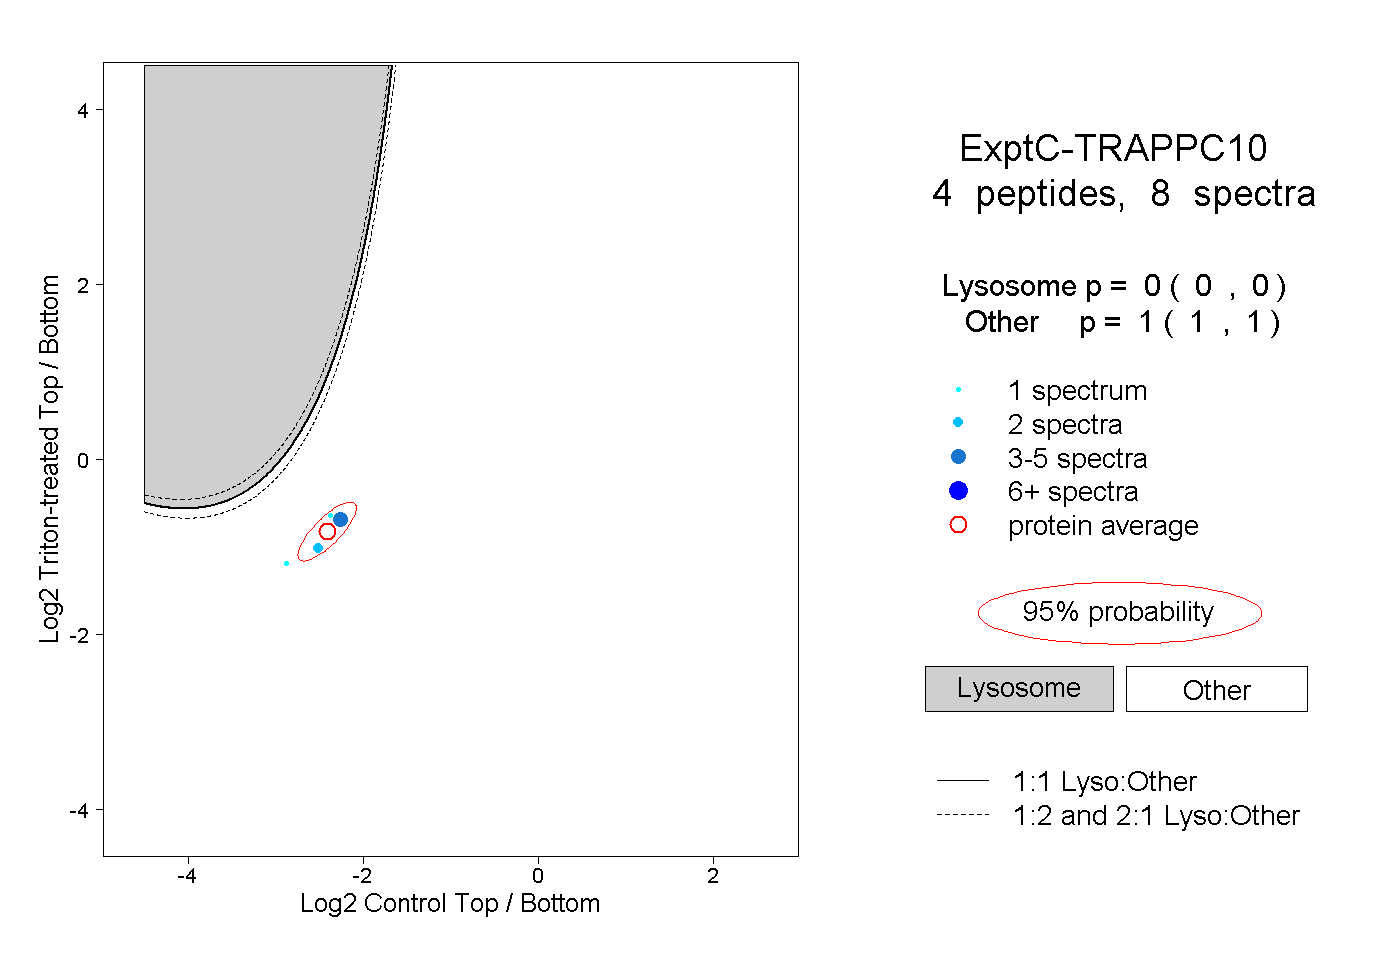
| Plot | Lyso | Other | |||||||||||
| Expt C |
4 peptides |
8 spectra |
|
0.000 0.000 | 0.000 |
1.000 1.000 | 1.000 |