 9
9peptides
spectra
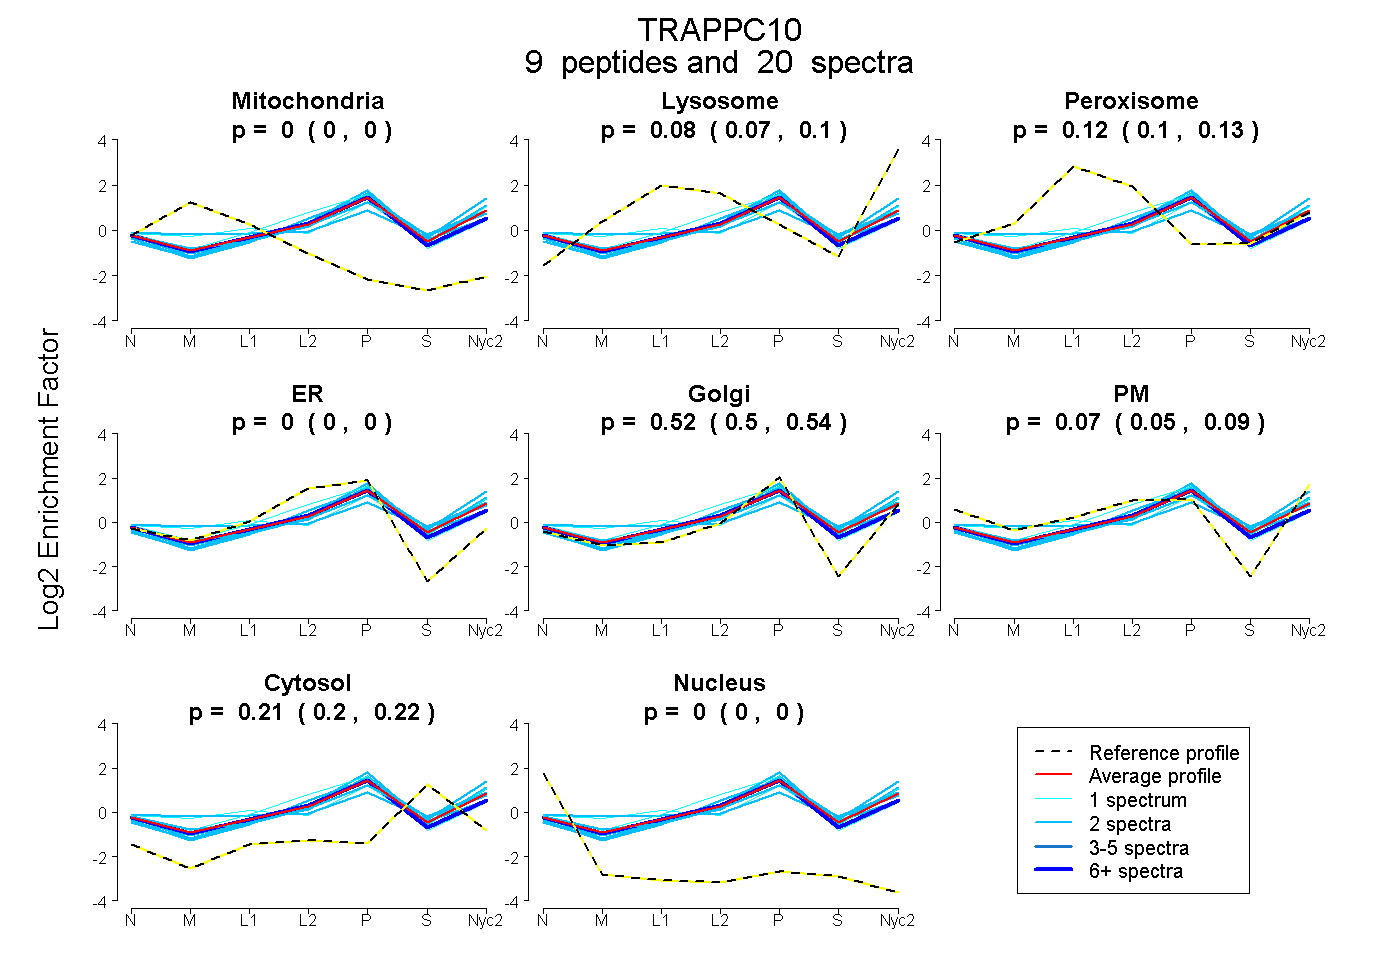
0.000 | 0.000
0.071 | 0.097
0.097 | 0.131
0.000 | 0.000
0.498 | 0.538
0.047 | 0.088
0.203 | 0.218
0.000 | 0.000
| Plot | Mito | Lyso | Perox | ER | Golgi | PM | Cytosol | Nucleus | |||||
| Expt A |
9 peptides |
20 spectra |
|
0.000 0.000 | 0.000 |
0.085 0.071 | 0.097 |
0.115 0.097 | 0.131 |
0.000 0.000 | 0.000 |
0.519 0.498 | 0.538 |
0.070 0.047 | 0.088 |
0.212 0.203 | 0.218 |
0.000 0.000 | 0.000 |
| 2 spectra, TLLLMSFTK | 0.000 | 0.146 | 0.000 | 0.174 | 0.350 | 0.045 | 0.285 | 0.000 | ||
| 1 spectrum, SYLFSR | 0.000 | 0.000 | 0.191 | 0.230 | 0.402 | 0.037 | 0.140 | 0.000 | ||
| 6 spectra, VVLPMHSFAR | 0.000 | 0.000 | 0.200 | 0.009 | 0.612 | 0.000 | 0.178 | 0.000 | ||
| 2 spectra, GPNSEDLNR | 0.000 | 0.000 | 0.155 | 0.000 | 0.620 | 0.000 | 0.225 | 0.000 | ||
| 2 spectra, SCGVIAMPLAAQATHR | 0.000 | 0.220 | 0.000 | 0.000 | 0.147 | 0.360 | 0.274 | 0.000 | ||
| 2 spectra, WQNVLK | 0.000 | 0.109 | 0.052 | 0.000 | 0.369 | 0.180 | 0.290 | 0.000 | ||
| 1 spectrum, LQEALSSVEAFEK | 0.000 | 0.124 | 0.146 | 0.000 | 0.424 | 0.125 | 0.181 | 0.000 | ||
| 2 spectra, FSVGFSPASAER | 0.000 | 0.162 | 0.008 | 0.000 | 0.530 | 0.078 | 0.223 | 0.000 | ||
| 2 spectra, FEDDMR | 0.000 | 0.196 | 0.000 | 0.027 | 0.575 | 0.000 | 0.202 | 0.000 |
| Plot | Lyso | Other | |||||||||||
| Expt C |
4 peptides |
8 spectra |
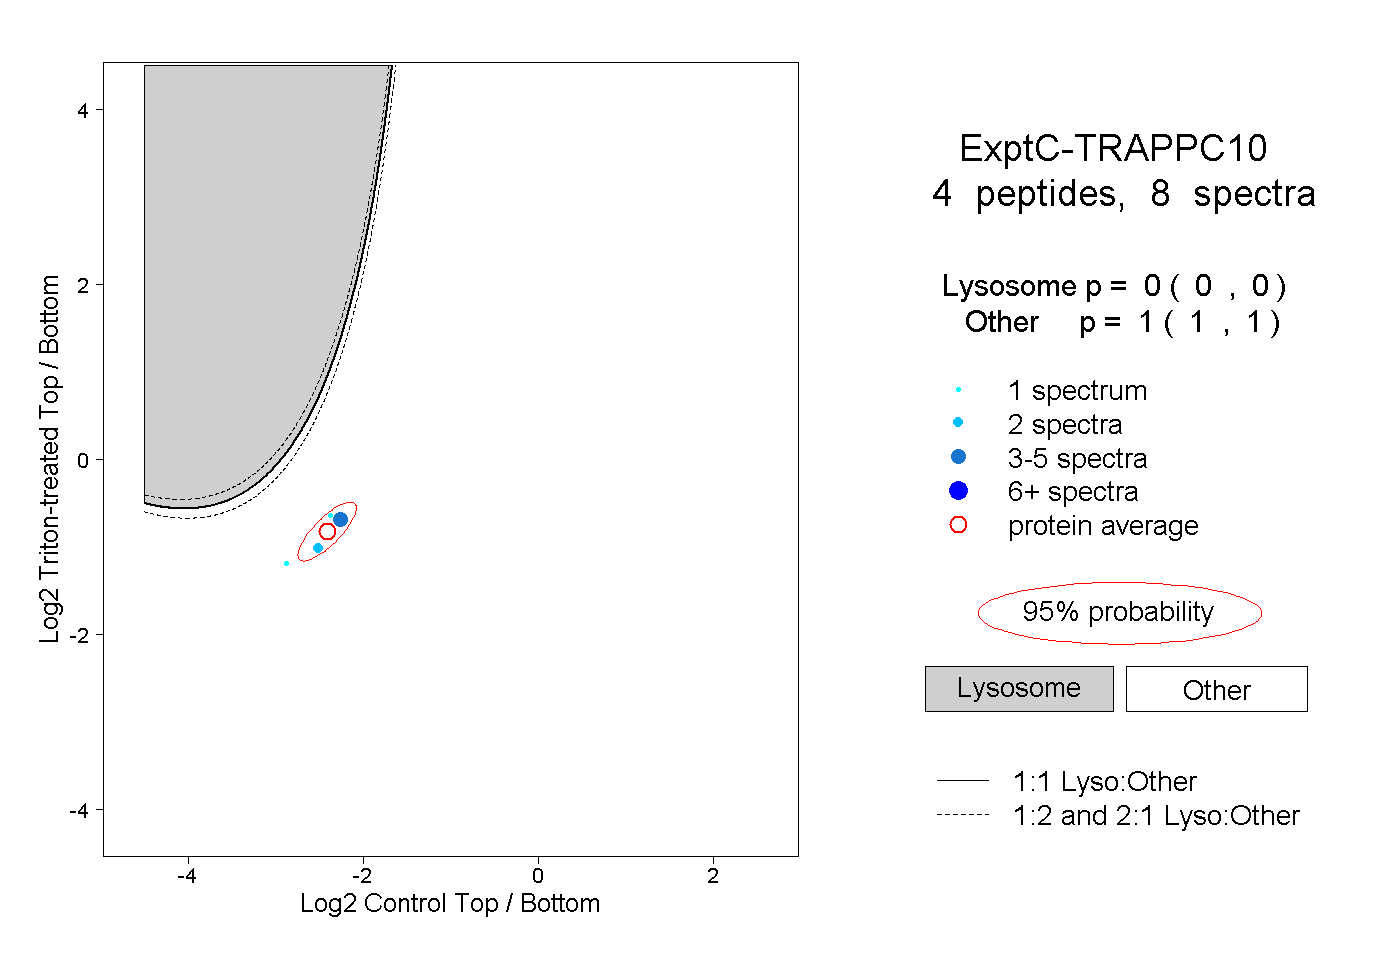 |
0.000 0.000 | 0.000 |
1.000 1.000 | 1.000 |