 3
3peptides
spectra
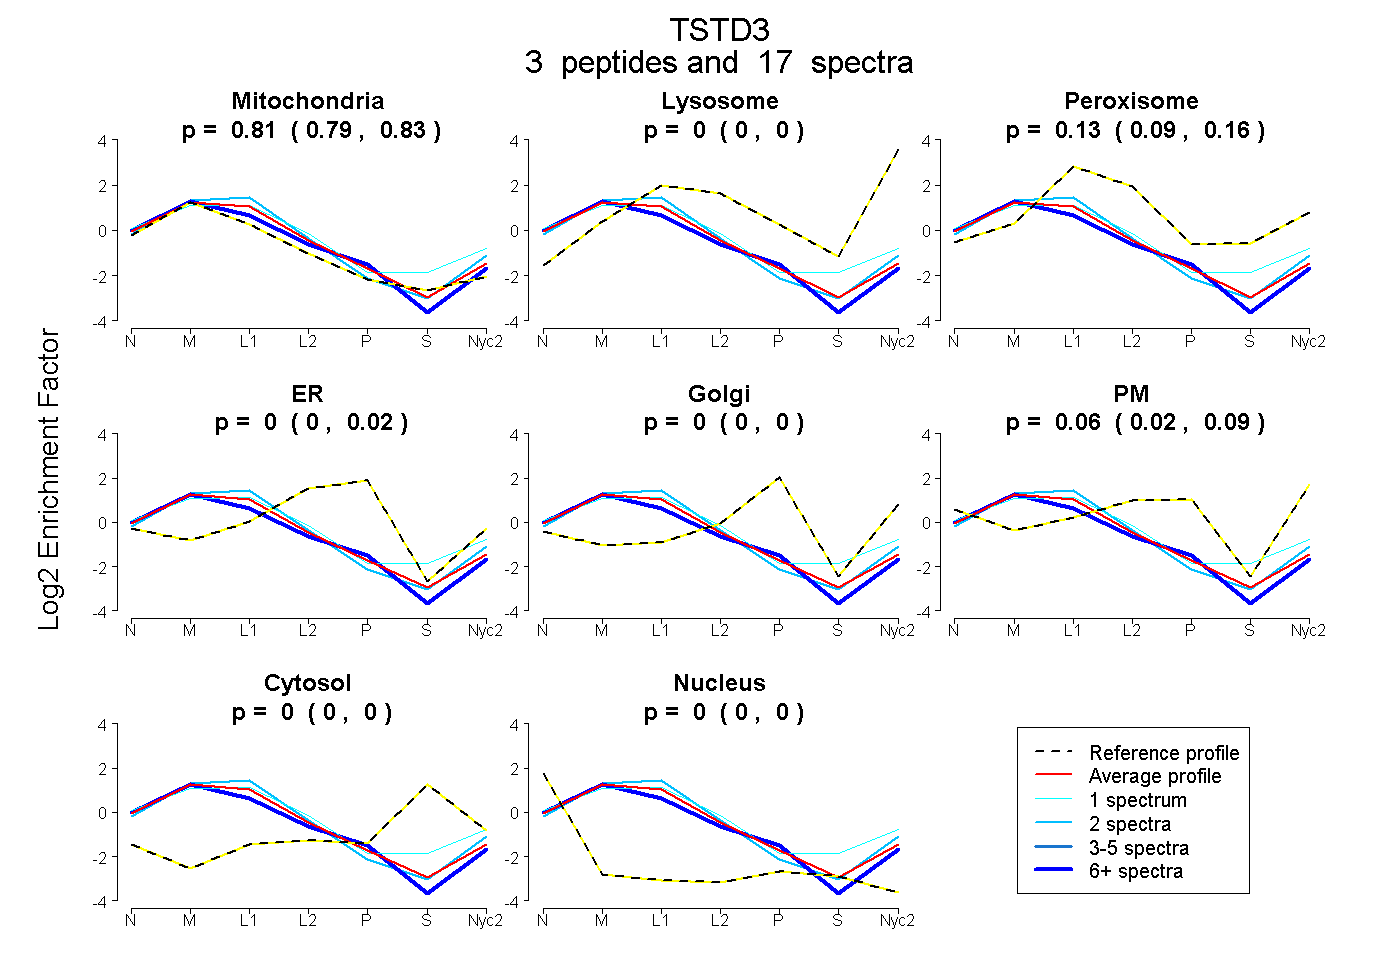
0.789 | 0.829
0.000 | 0.000
0.088 | 0.158
0.000 | 0.021
0.000 | 0.000
0.021 | 0.088
0.000 | 0.000
0.000 | 0.000
1peptide
spectra
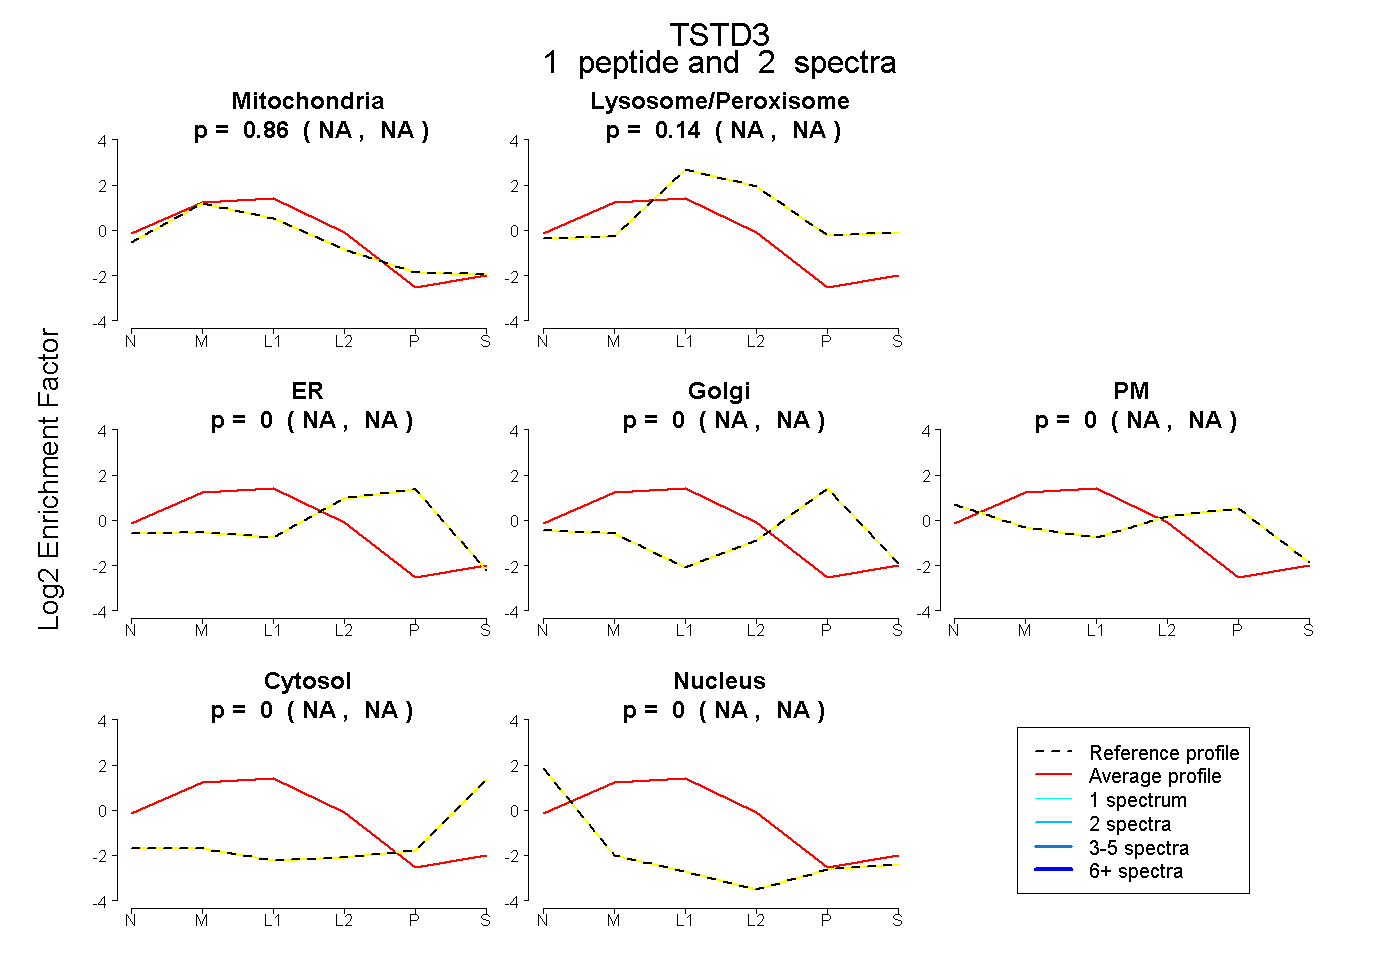
NA | NA
NA | NA
NA | NA
NA | NA
NA | NA
NA | NA
NA | NA
5peptides
spectra
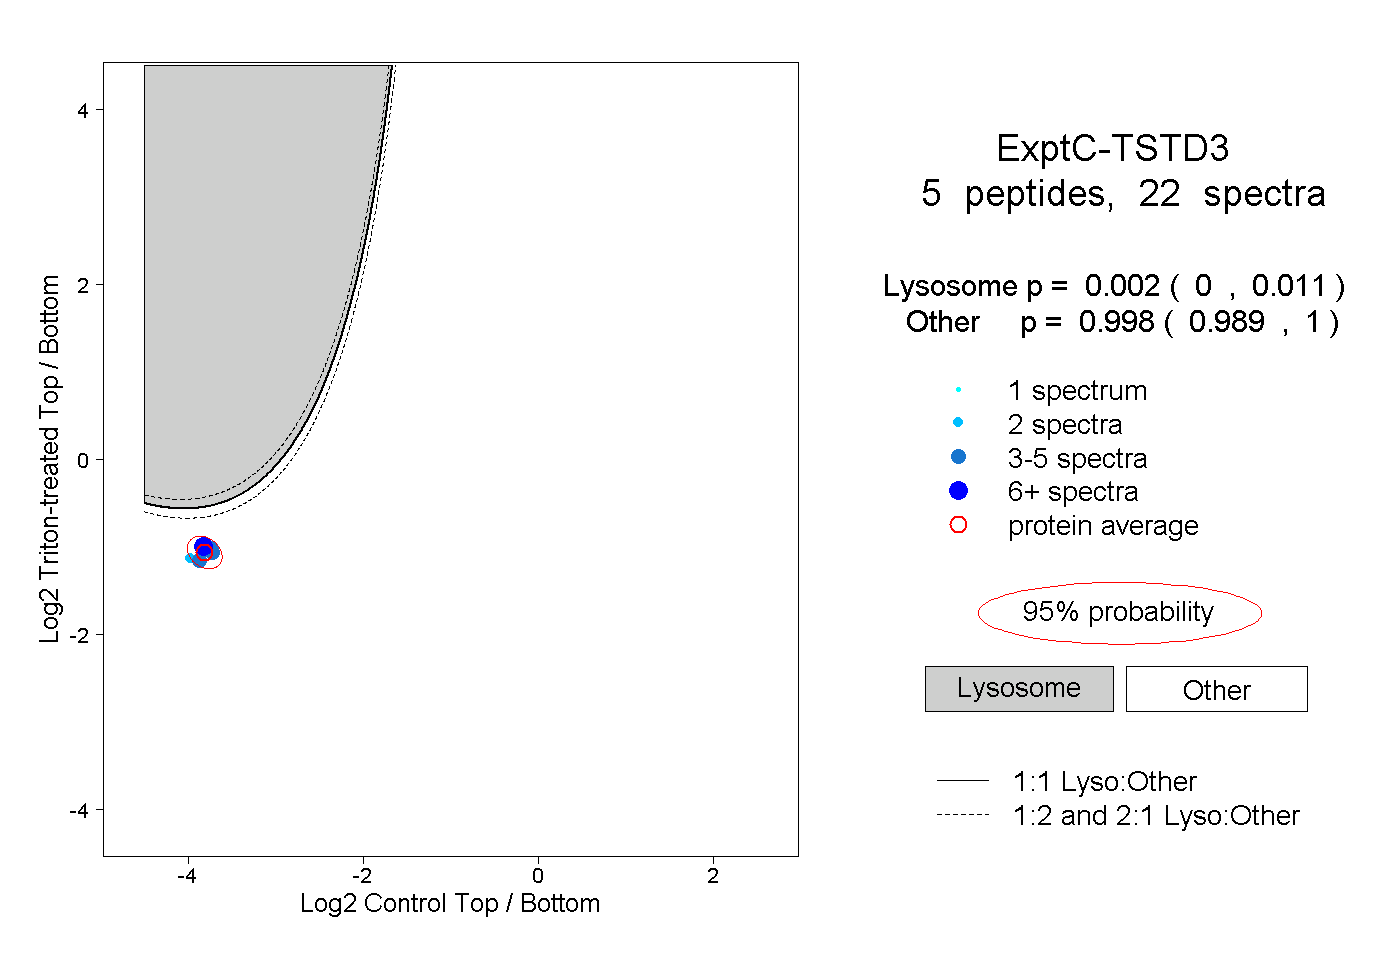
0.000 | 0.011
0.989 | 1.000