 3
3peptides
spectra
0.789 | 0.829
0.000 | 0.000
0.088 | 0.158
0.000 | 0.021
0.000 | 0.000
0.021 | 0.088
0.000 | 0.000
0.000 | 0.000
| Plot | Mito | Lyso | Perox | ER | Golgi | PM | Cytosol | Nucleus | |||||
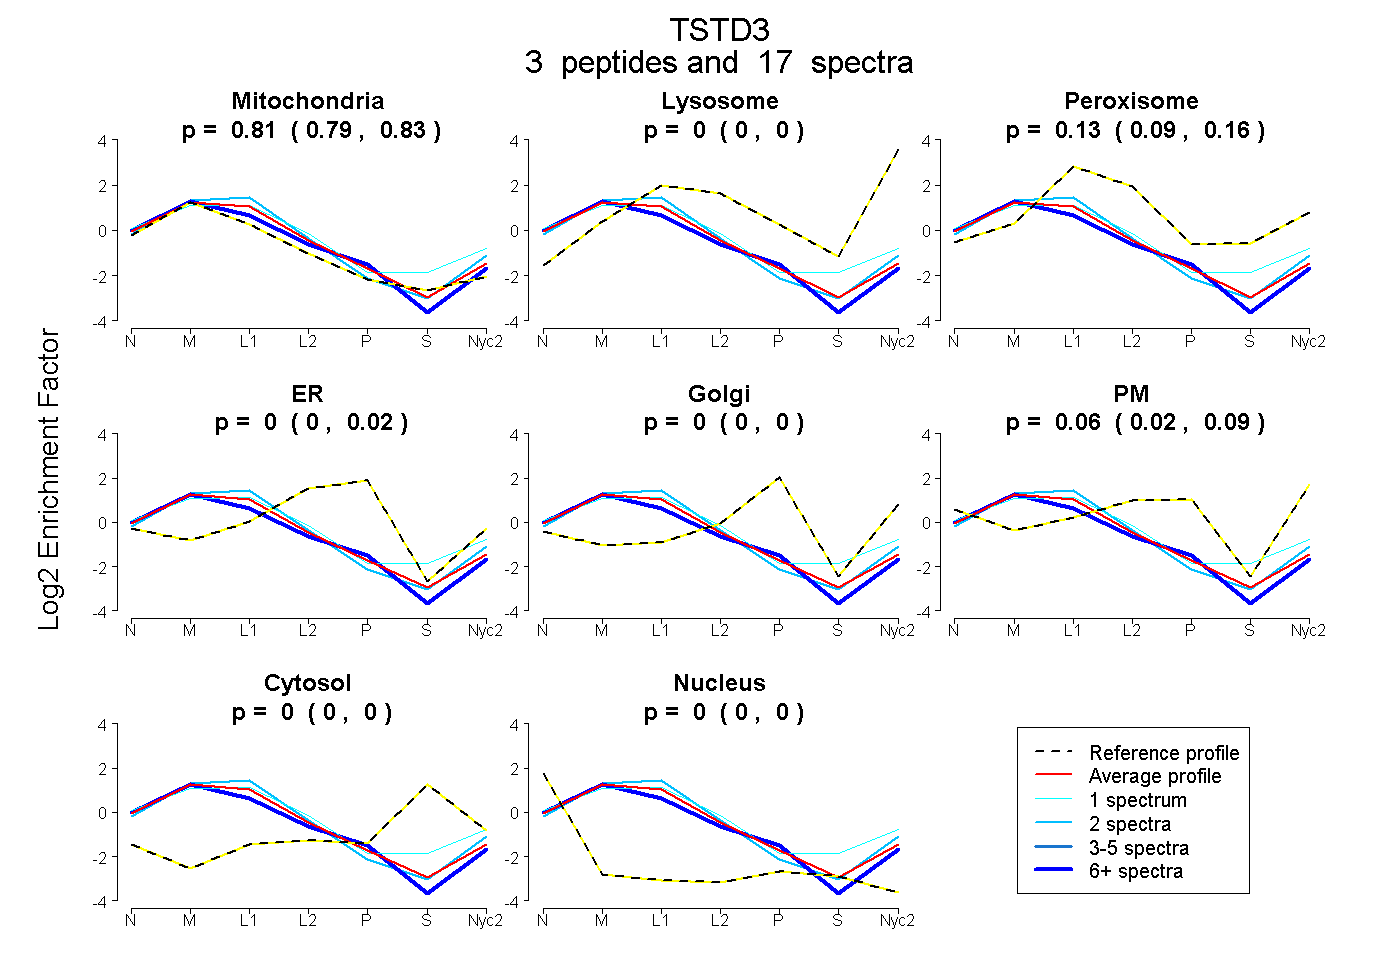
| Expt A |
3 peptides |
17 spectra |
|
0.811 0.789 | 0.829 |
0.000 0.000 | 0.000 |
0.127 0.088 | 0.158 |
0.000 0.000 | 0.021 |
0.000 0.000 | 0.000 |
0.062 0.021 | 0.088 |
0.000 0.000 | 0.000 |
0.000 0.000 | 0.000 |
| 2 spectra, DIMLIDVR | 0.788 | 0.045 | 0.167 | 0.000 | 0.000 | 0.000 | 0.000 | 0.000 | ||
| 1 spectrum, NTWEILEHGK | 0.659 | 0.011 | 0.318 | 0.000 | 0.000 | 0.012 | 0.000 | 0.000 | ||
| 14 spectra, LVFSCLAGVR | 0.856 | 0.000 | 0.000 | 0.088 | 0.000 | 0.056 | 0.000 | 0.000 |
| Plot | Mito | Lyso or Perox | ER | Golgi | PM | Cytosol | Nucleus | ||||||
| Expt B |
1 peptide |
2 spectra |
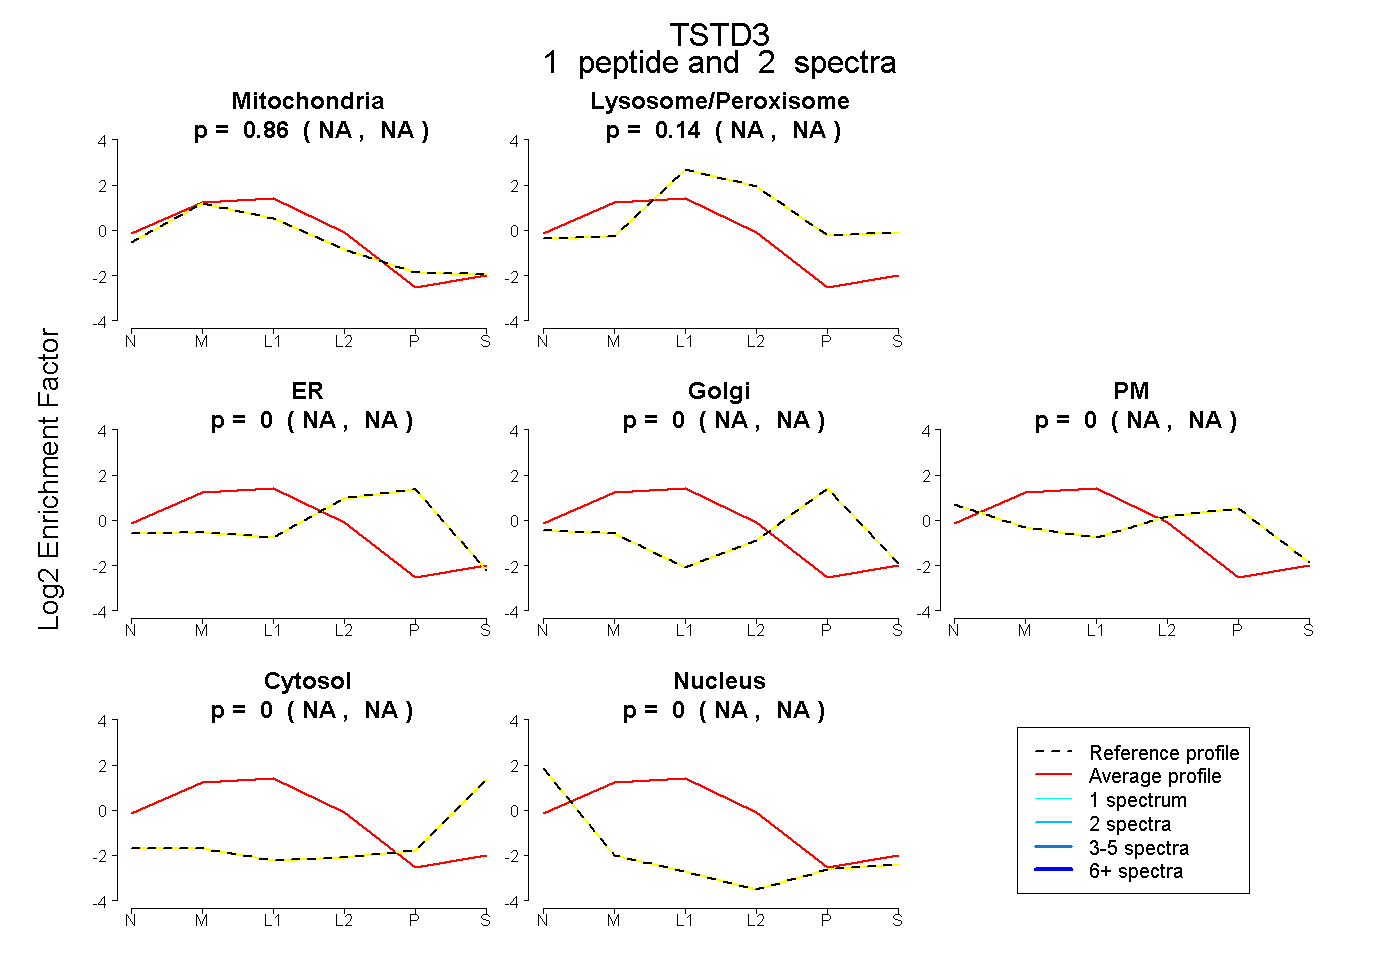 |
0.864 NA | NA |
0.136 NA | NA |
0.000 NA | NA |
0.000 NA | NA |
0.000 NA | NA |
0.000 NA | NA |
0.000 NA | NA |
|||
| Plot | Lyso | Other | |||||||||||
| Expt C |
5 peptides |
22 spectra |
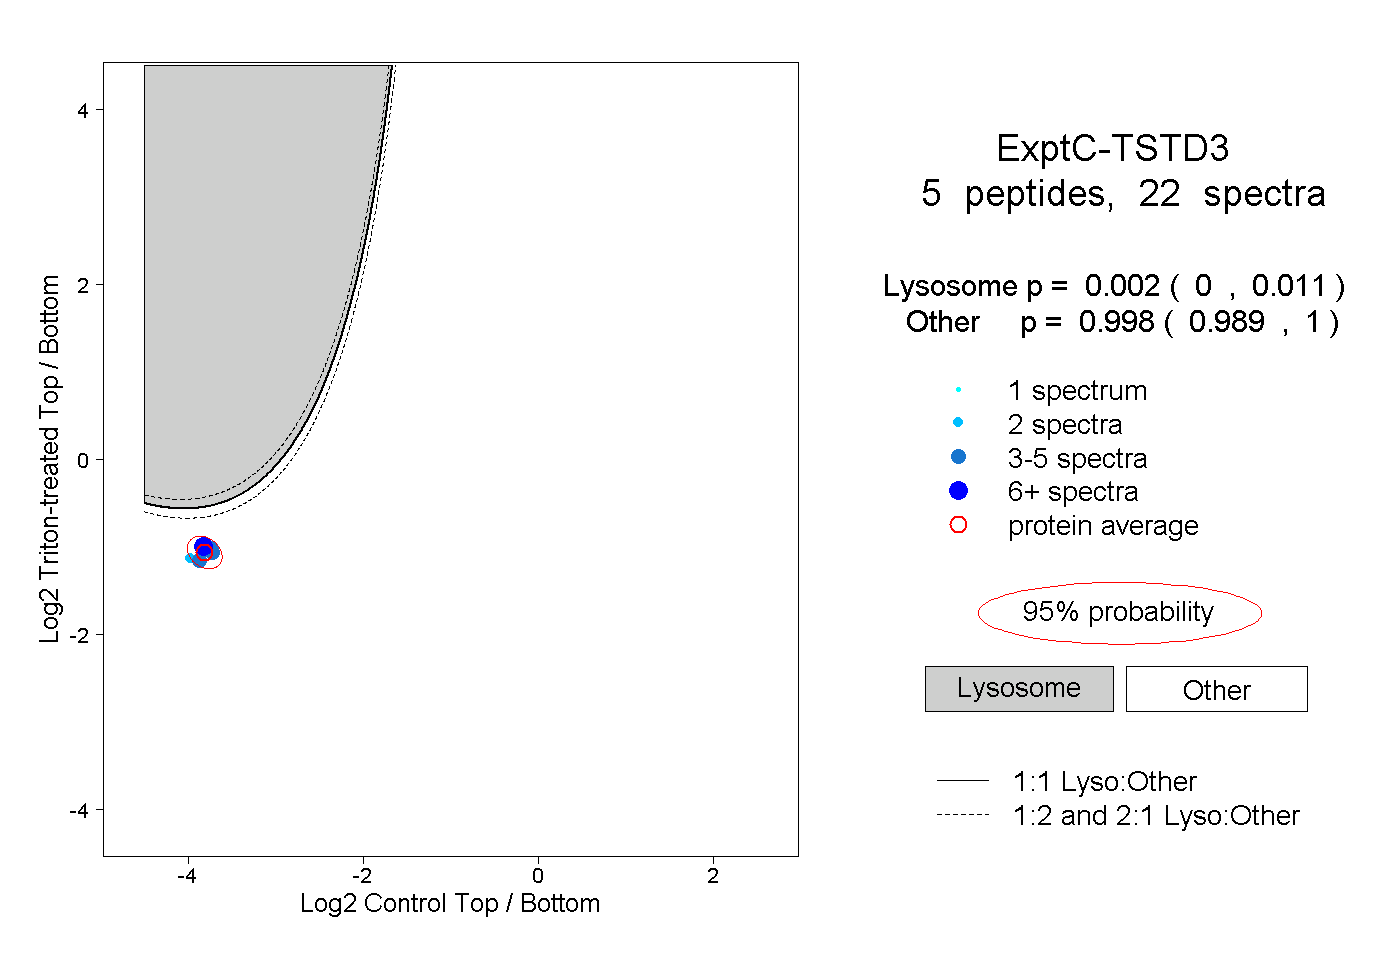 |
0.002 0.000 | 0.011 |
0.998 0.989 | 1.000 |