 29
29peptides
spectra
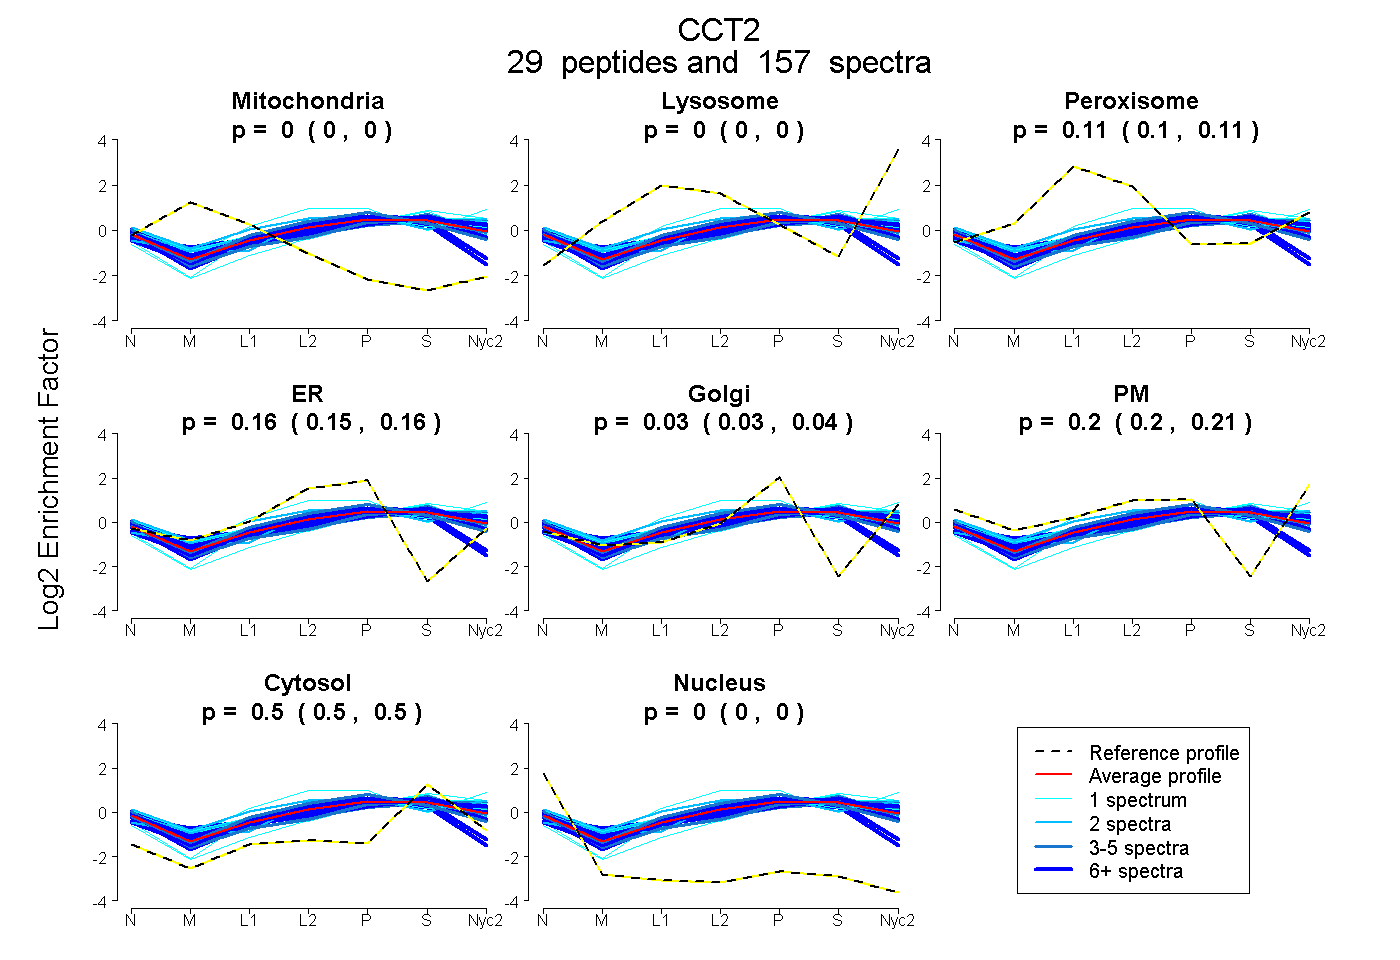
0.000 | 0.000
0.000 | 0.000
0.104 | 0.108
0.151 | 0.164
0.027 | 0.039
0.196 | 0.205
0.499 | 0.503
0.000 | 0.000
17peptides
spectra
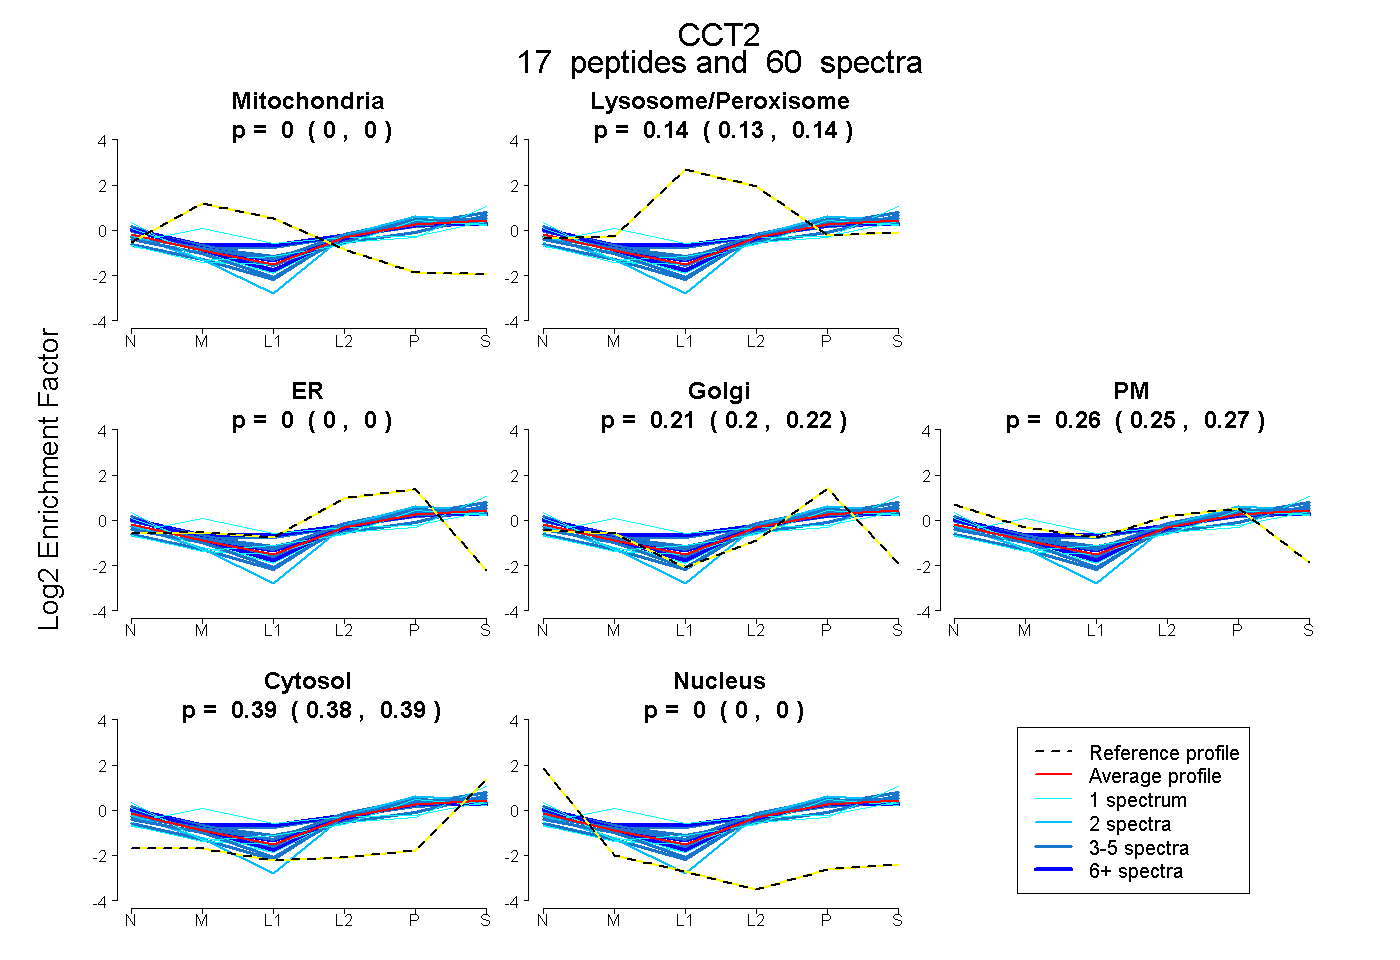
0.000 | 0.000
0.129 | 0.143
0.000 | 0.000
0.202 | 0.222
0.248 | 0.275
0.384 | 0.391
0.000 | 0.000
23peptides
spectra
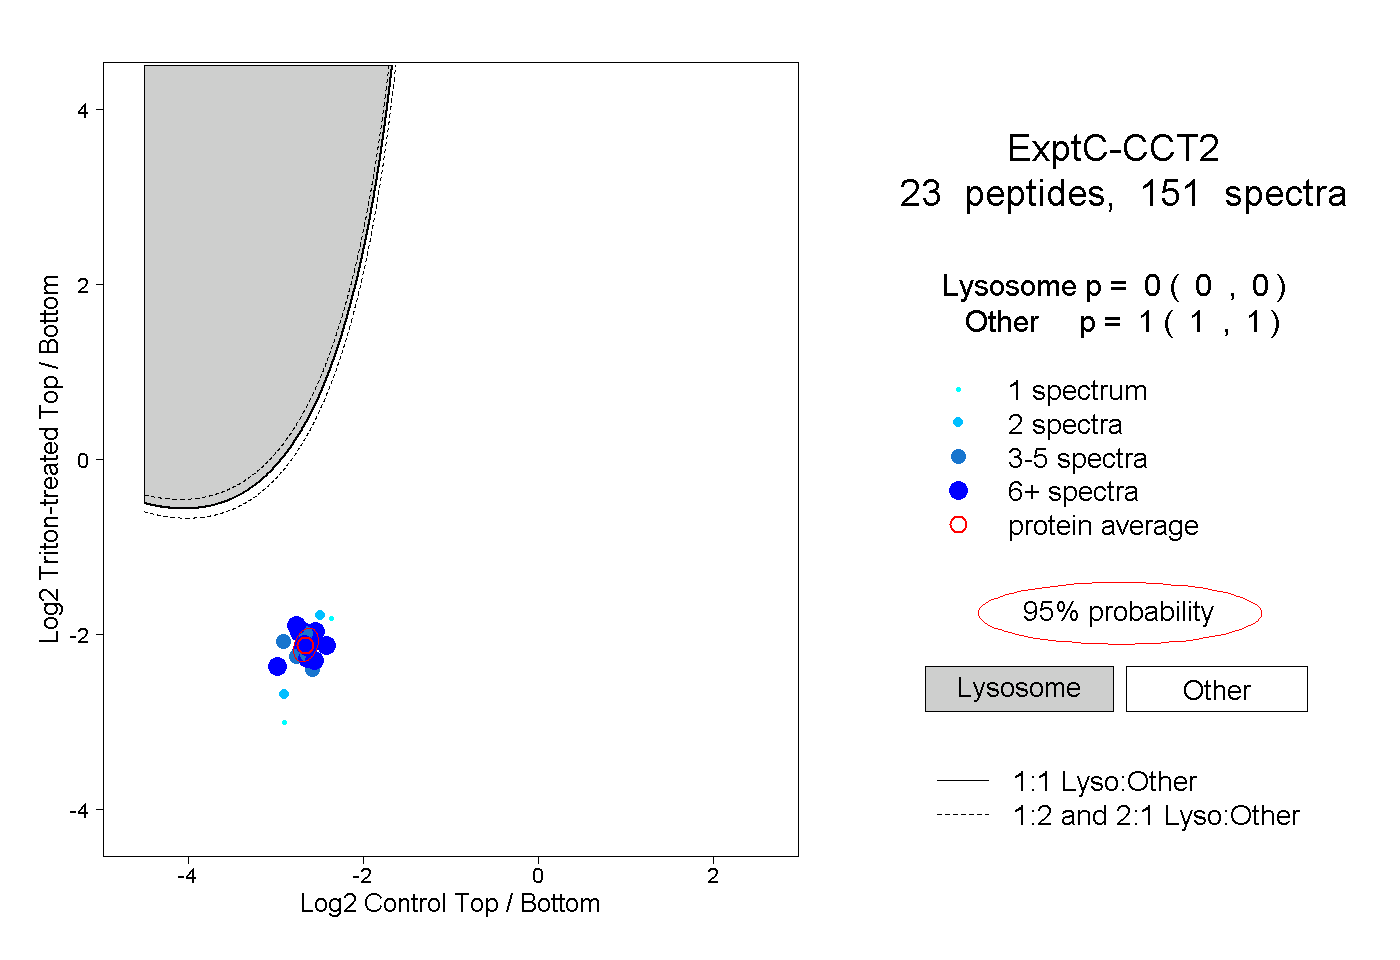
0.000 | 0.000
1.000 | 1.000
12peptides
spectra
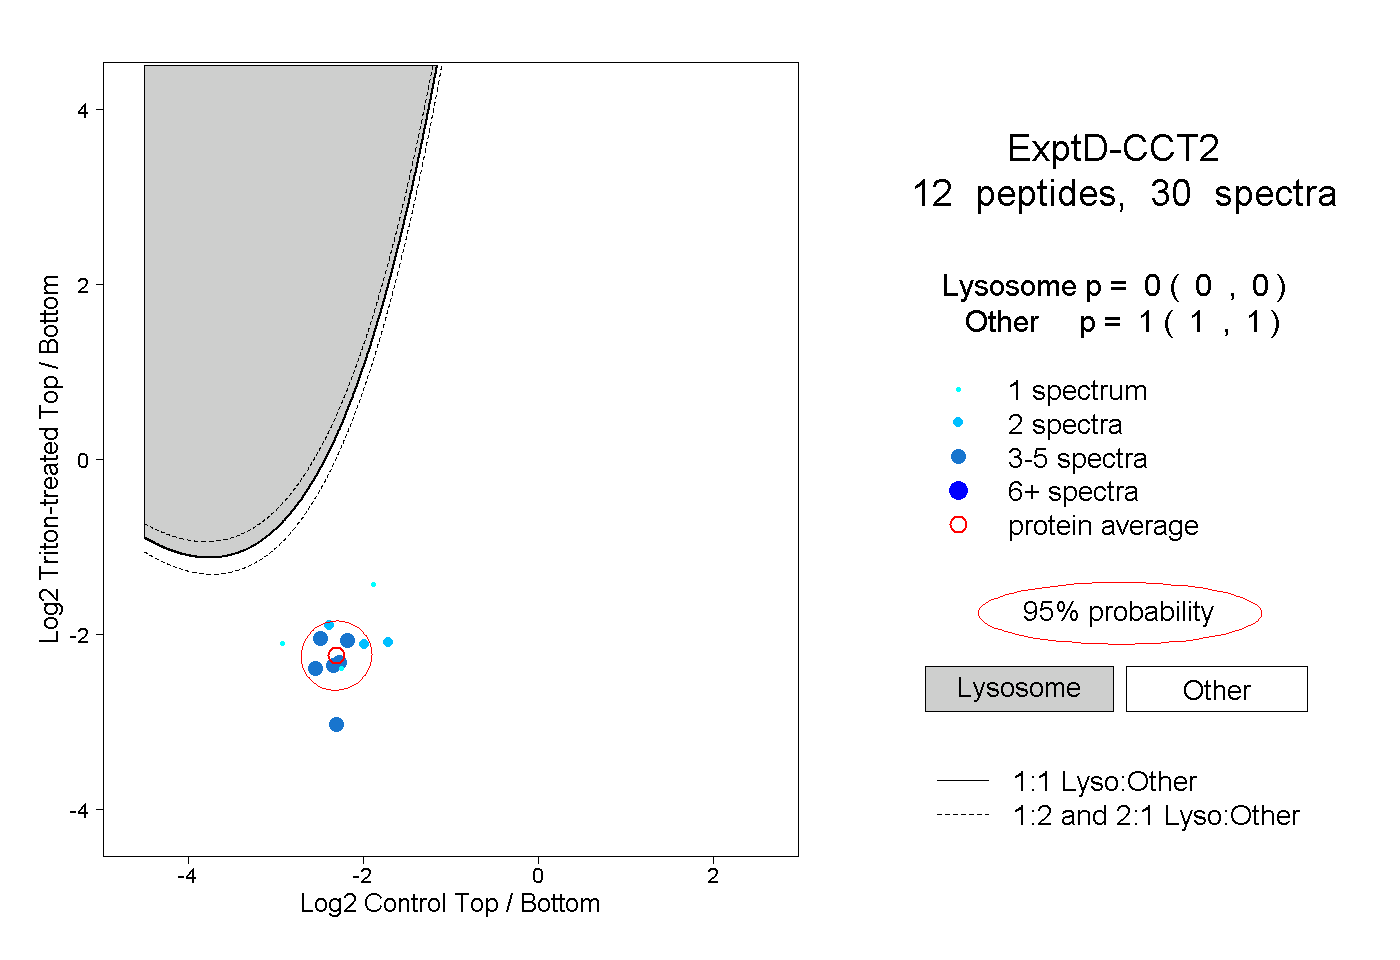
0.000 | 0.000
1.000 | 1.000