 29
29peptides
spectra
0.000 | 0.000
0.000 | 0.000
0.104 | 0.108
0.151 | 0.164
0.027 | 0.039
0.196 | 0.205
0.499 | 0.503
0.000 | 0.000
| Plot | Mito | Lyso | Perox | ER | Golgi | PM | Cytosol | Nucleus | |||||
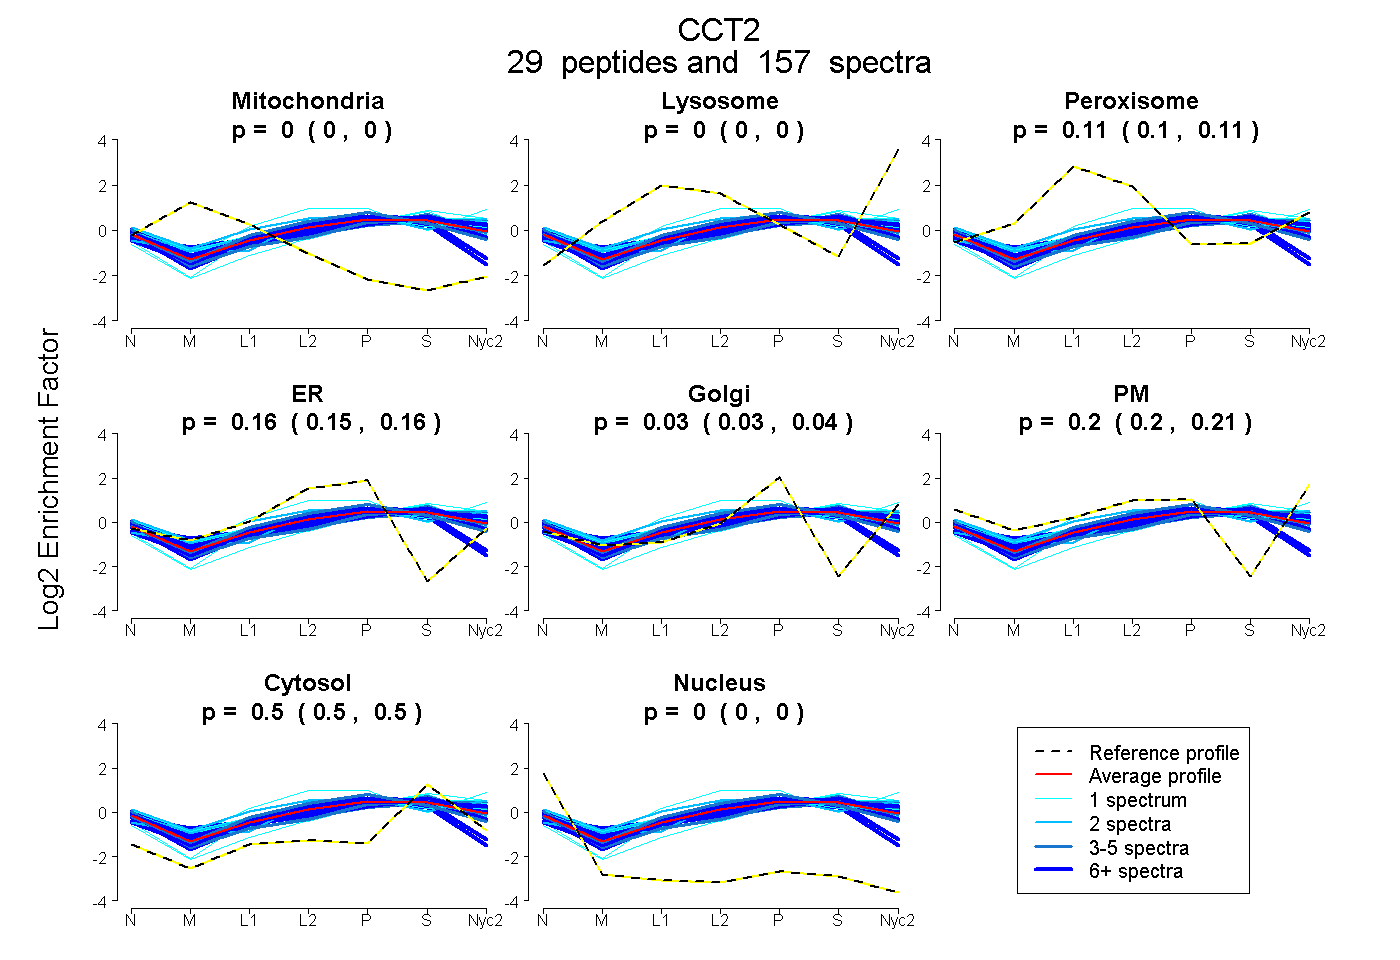
| Expt A |
29 peptides |
157 spectra |
|
0.000 0.000 | 0.000 |
0.000 0.000 | 0.000 |
0.106 0.104 | 0.108 |
0.158 0.151 | 0.164 |
0.034 0.027 | 0.039 |
0.201 0.196 | 0.205 |
0.501 0.499 | 0.503 |
0.000 0.000 | 0.000 |
| 2 spectra, LSSFIGAIAIGDLVK | 0.000 | 0.000 | 0.212 | 0.022 | 0.060 | 0.373 | 0.332 | 0.000 | ||
| 6 spectra, DASLMVTNDGATILK | 0.000 | 0.000 | 0.104 | 0.118 | 0.016 | 0.271 | 0.491 | 0.000 | ||
| 6 spectra, VPDHHPC | 0.009 | 0.000 | 0.088 | 0.376 | 0.000 | 0.000 | 0.522 | 0.005 | ||
| 1 spectrum, ILIANTGMDTDK | 0.000 | 0.001 | 0.068 | 0.000 | 0.000 | 0.416 | 0.514 | 0.000 | ||
| 11 spectra, LIEEVMIGEDK | 0.000 | 0.000 | 0.183 | 0.000 | 0.211 | 0.090 | 0.515 | 0.000 | ||
| 4 spectra, IGVNQPK | 0.000 | 0.000 | 0.067 | 0.128 | 0.000 | 0.304 | 0.501 | 0.000 | ||
| 8 spectra, LLTHHK | 0.000 | 0.000 | 0.157 | 0.132 | 0.054 | 0.203 | 0.455 | 0.000 | ||
| 1 spectrum, NIGVDNPAAK | 0.000 | 0.000 | 0.160 | 0.113 | 0.000 | 0.278 | 0.450 | 0.000 | ||
| 3 spectra, VQDDEVGDGTTSVTVLAAELLR | 0.000 | 0.000 | 0.144 | 0.390 | 0.015 | 0.001 | 0.451 | 0.000 | ||
| 12 spectra, GATQQILDEAER | 0.000 | 0.000 | 0.121 | 0.041 | 0.102 | 0.222 | 0.515 | 0.000 | ||
| 2 spectra, VDNIIK | 0.000 | 0.042 | 0.046 | 0.322 | 0.000 | 0.101 | 0.489 | 0.000 | ||
| 6 spectra, EAVAMESFAK | 0.000 | 0.000 | 0.095 | 0.106 | 0.000 | 0.320 | 0.479 | 0.000 | ||
| 1 spectrum, EGSIGDMAVLGITESFQVK | 0.000 | 0.000 | 0.162 | 0.000 | 0.244 | 0.000 | 0.594 | 0.000 | ||
| 4 spectra, GSGNLEAIHVIK | 0.000 | 0.000 | 0.162 | 0.006 | 0.171 | 0.099 | 0.561 | 0.000 | ||
| 10 spectra, HGINCFINR | 0.000 | 0.000 | 0.044 | 0.417 | 0.000 | 0.000 | 0.495 | 0.045 | ||
| 23 spectra, TVYGGGCSEMLMAHAVTMLASR | 0.000 | 0.000 | 0.162 | 0.261 | 0.081 | 0.000 | 0.496 | 0.000 | ||
| 7 spectra, VAEIEHAEK | 0.000 | 0.000 | 0.070 | 0.129 | 0.104 | 0.165 | 0.532 | 0.000 | ||
| 2 spectra, EAESLIAK | 0.000 | 0.000 | 0.138 | 0.139 | 0.079 | 0.141 | 0.503 | 0.000 | ||
| 6 spectra, VLVDMSR | 0.000 | 0.000 | 0.093 | 0.129 | 0.009 | 0.286 | 0.484 | 0.000 | ||
| 2 spectra, QVLLSAAEAAEVILR | 0.000 | 0.000 | 0.184 | 0.015 | 0.106 | 0.277 | 0.417 | 0.000 | ||
| 5 spectra, IHPQTIIAGWR | 0.000 | 0.010 | 0.033 | 0.000 | 0.079 | 0.357 | 0.521 | 0.000 | ||
| 8 spectra, ITAGLDMK | 0.000 | 0.000 | 0.195 | 0.108 | 0.171 | 0.113 | 0.414 | 0.000 | ||
| 5 spectra, VDSTAK | 0.000 | 0.000 | 0.000 | 0.085 | 0.000 | 0.330 | 0.584 | 0.000 | ||
| 1 spectrum, FWQDLMNIAGTTLSSK | 0.000 | 0.092 | 0.132 | 0.138 | 0.000 | 0.344 | 0.294 | 0.000 | ||
| 3 spectra, ASLSLAPVNIFK | 0.020 | 0.000 | 0.115 | 0.142 | 0.025 | 0.173 | 0.524 | 0.000 | ||
| 7 spectra, LAVEAVLR | 0.000 | 0.000 | 0.098 | 0.140 | 0.044 | 0.191 | 0.528 | 0.000 | ||
| 9 spectra, ILLSSGR | 0.000 | 0.000 | 0.087 | 0.190 | 0.000 | 0.238 | 0.485 | 0.000 | ||
| 1 spectrum, SLHDALCVLAQTVK | 0.000 | 0.000 | 0.149 | 0.026 | 0.070 | 0.363 | 0.392 | 0.000 | ||
| 1 spectrum, LGGSLADSYLDEGFLLDK | 0.000 | 0.085 | 0.000 | 0.000 | 0.228 | 0.060 | 0.627 | 0.000 |
| Plot | Mito | Lyso or Perox | ER | Golgi | PM | Cytosol | Nucleus | ||||||
| Expt B |
17 peptides |
60 spectra |
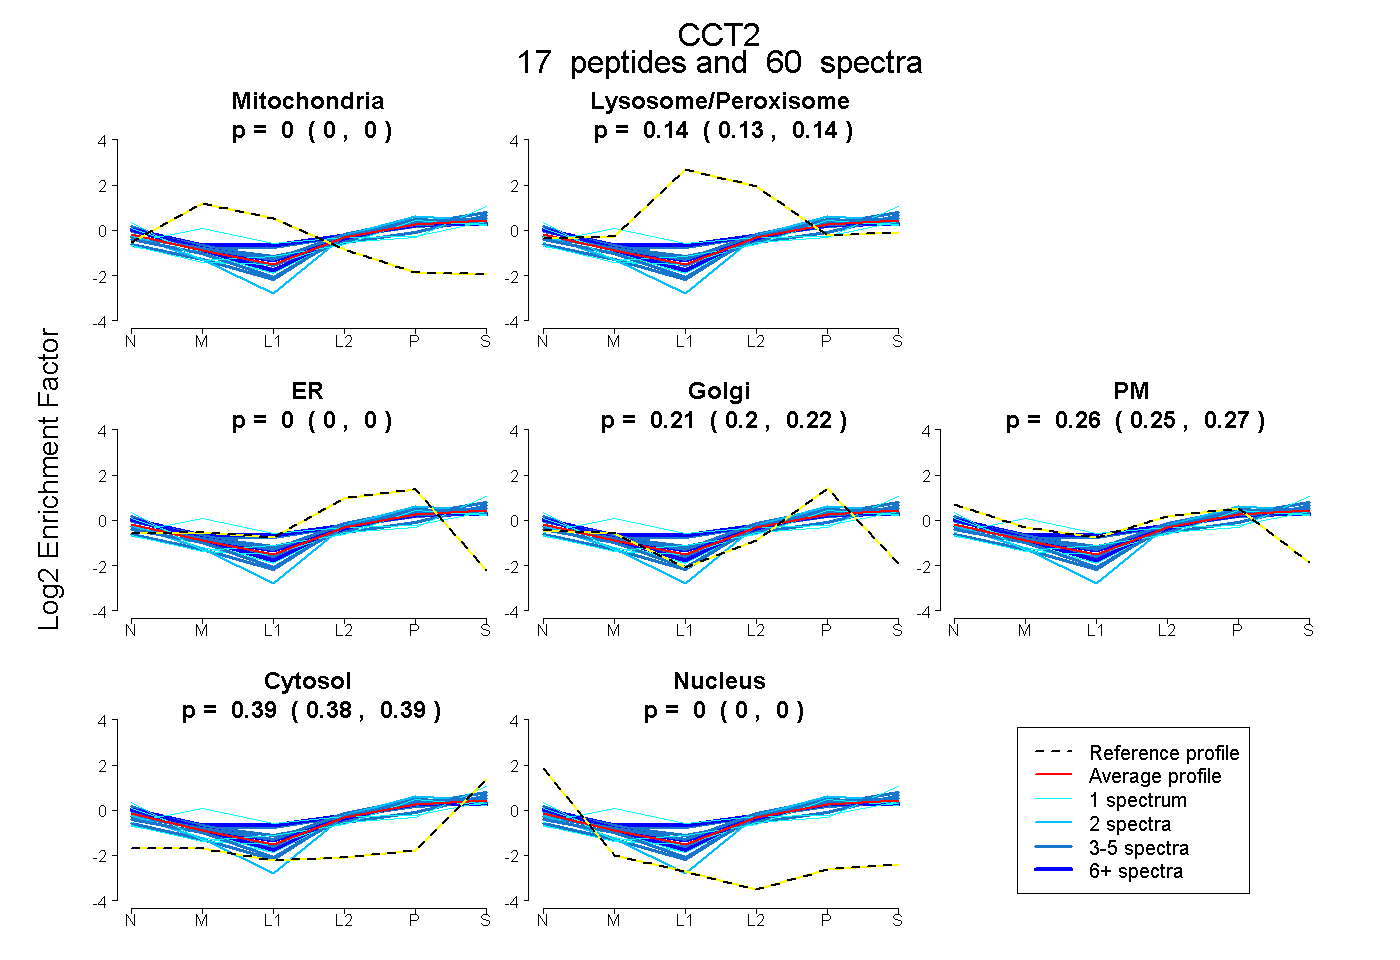 |
0.000 0.000 | 0.000 |
0.137 0.129 | 0.143 |
0.000 0.000 | 0.000 |
0.213 0.202 | 0.222 |
0.262 0.248 | 0.275 |
0.388 0.384 | 0.391 |
0.000 0.000 | 0.000 |
|||
| Plot | Lyso | Other | |||||||||||
| Expt C |
23 peptides |
151 spectra |
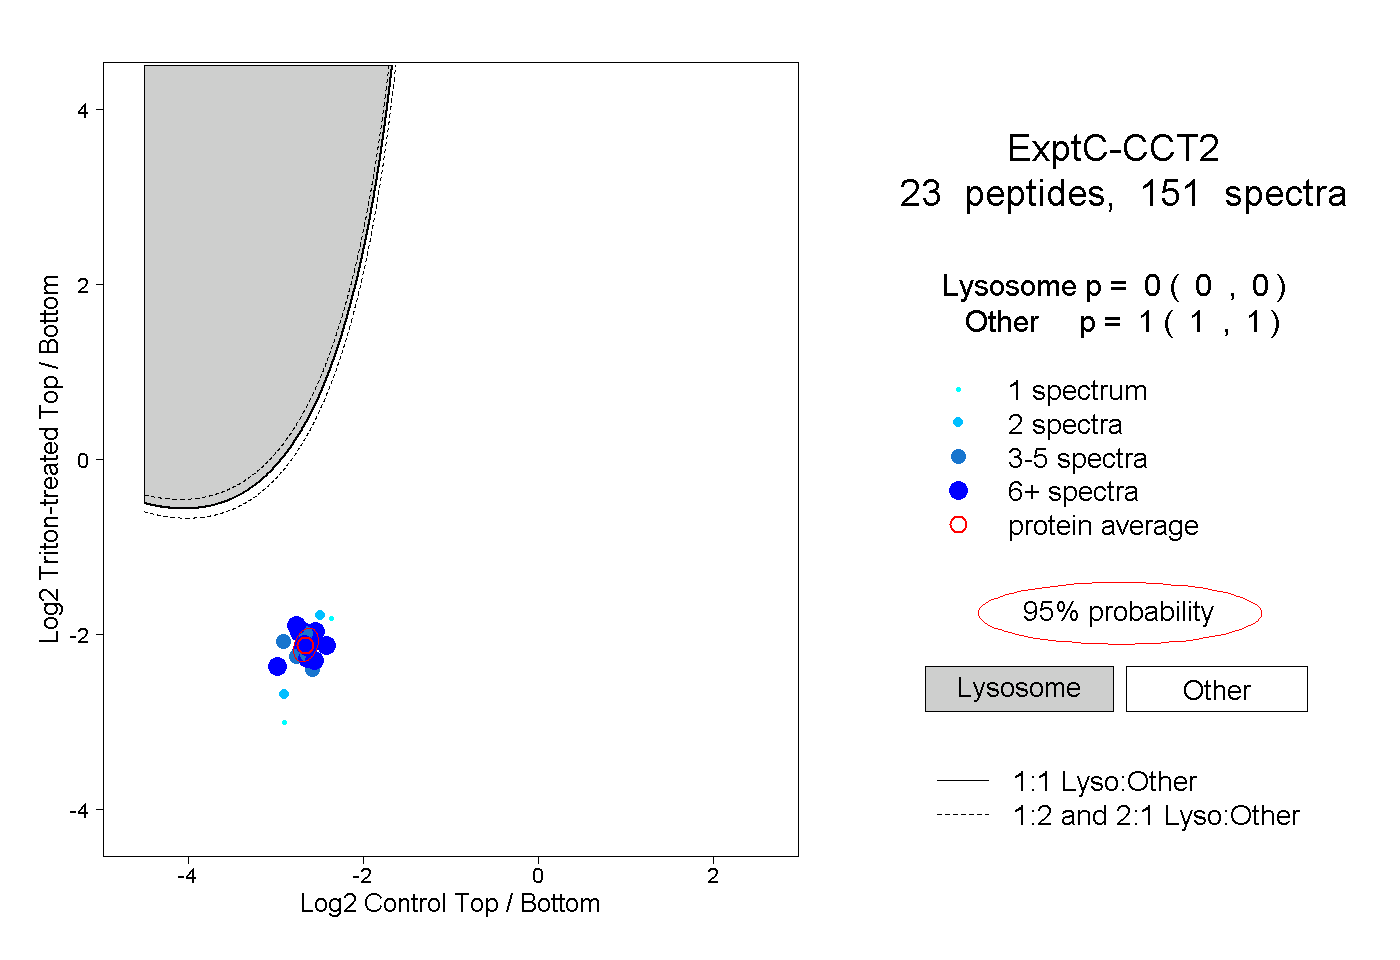 |
0.000 0.000 | 0.000 |
1.000 1.000 | 1.000 |
||||||||
| Plot | Lyso | Other | |||||||||||
| Expt D |
12 peptides |
30 spectra |
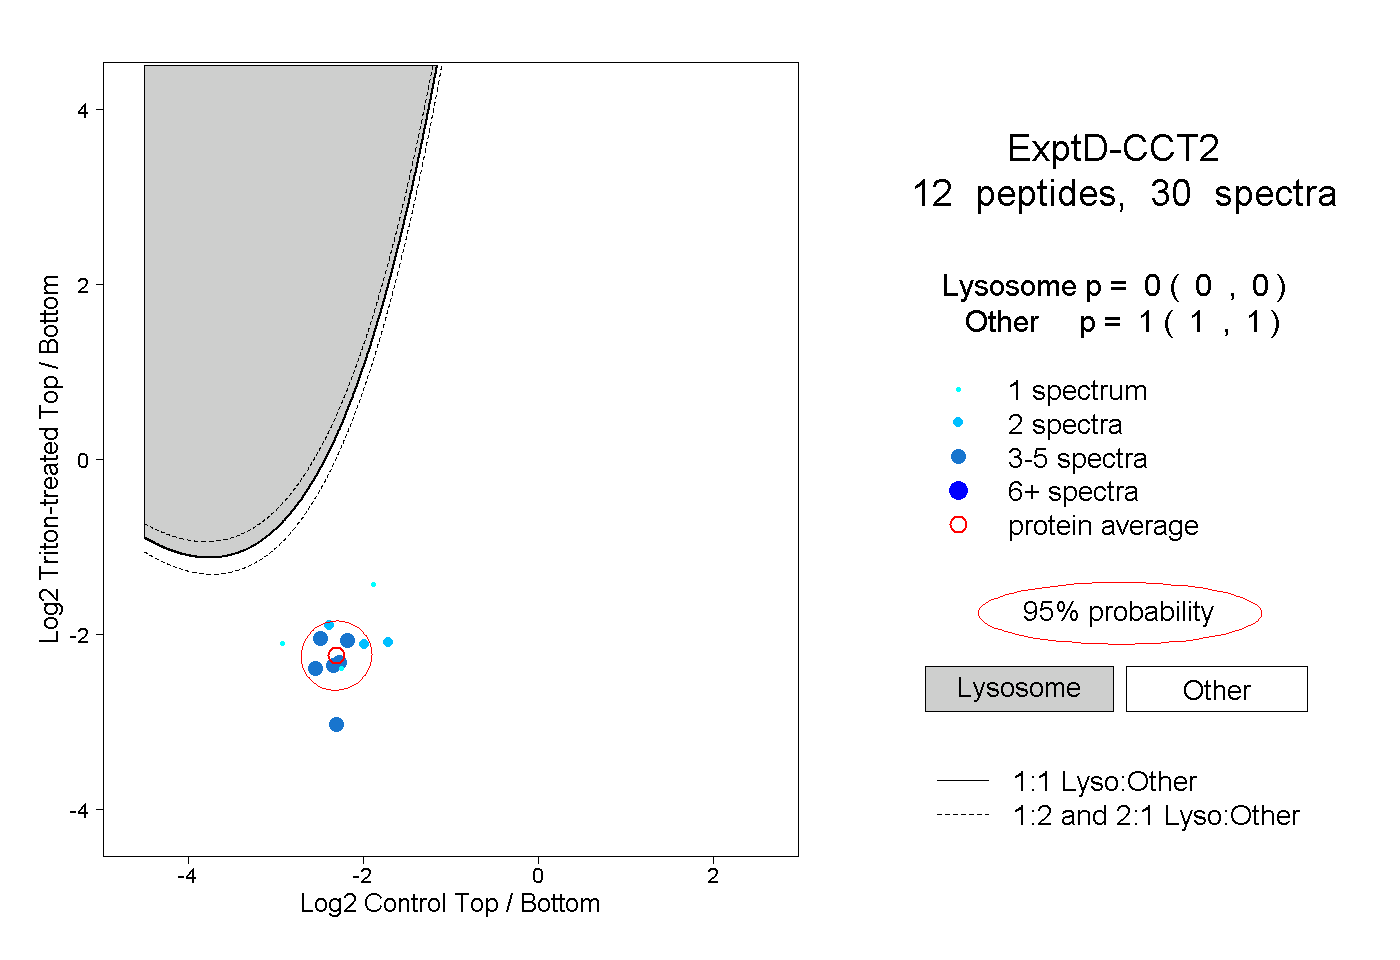 |
0.000 0.000 | 0.000 |
1.000 1.000 | 1.000 |