 7
7peptides
spectra
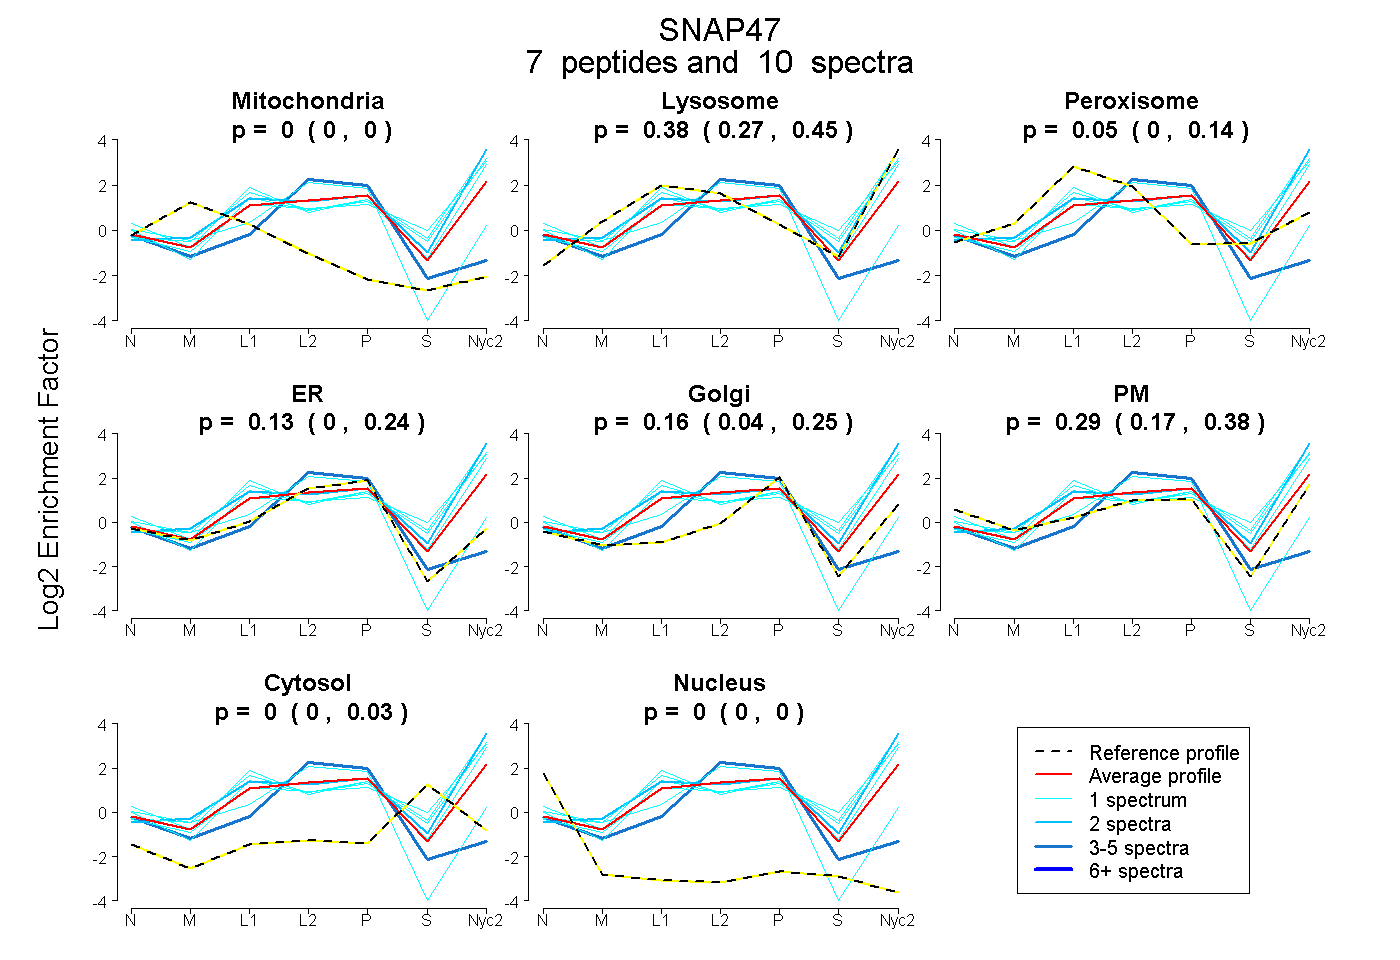
0.000 | 0.000
0.273 | 0.449
0.000 | 0.144
0.000 | 0.236
0.035 | 0.253
0.169 | 0.377
0.000 | 0.030
0.000 | 0.000
2peptides
spectra
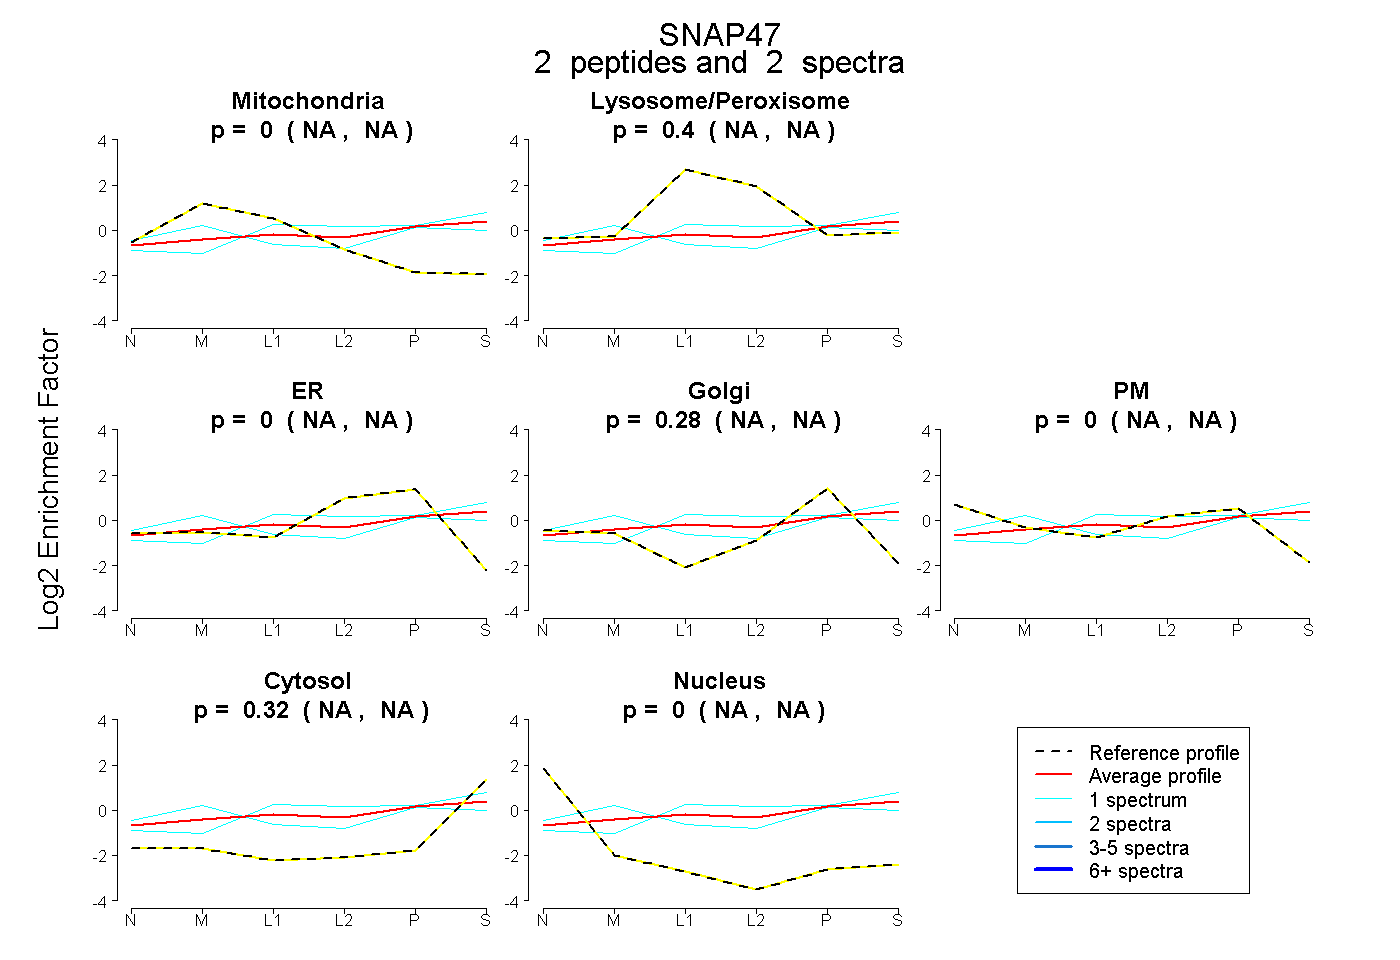
NA | NA
NA | NA
NA | NA
NA | NA
NA | NA
NA | NA
NA | NA
8peptides
spectra
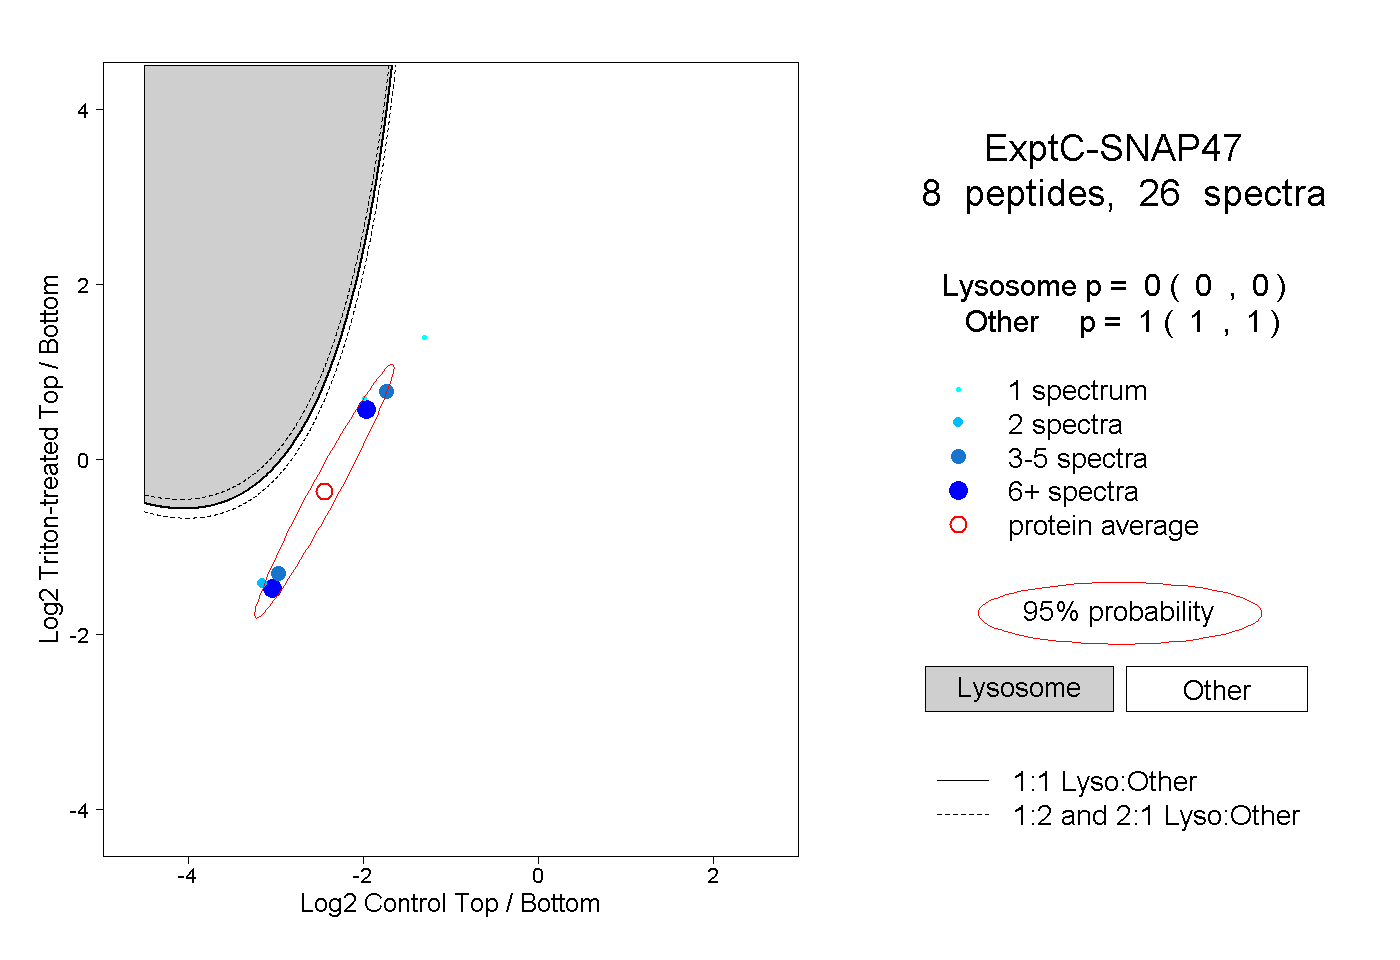
0.000 | 0.000
1.000 | 1.000