 7
7peptides
spectra
0.000 | 0.000
0.273 | 0.449
0.000 | 0.144
0.000 | 0.236
0.035 | 0.253
0.169 | 0.377
0.000 | 0.030
0.000 | 0.000
| Plot | Mito | Lyso | Perox | ER | Golgi | PM | Cytosol | Nucleus | |||||
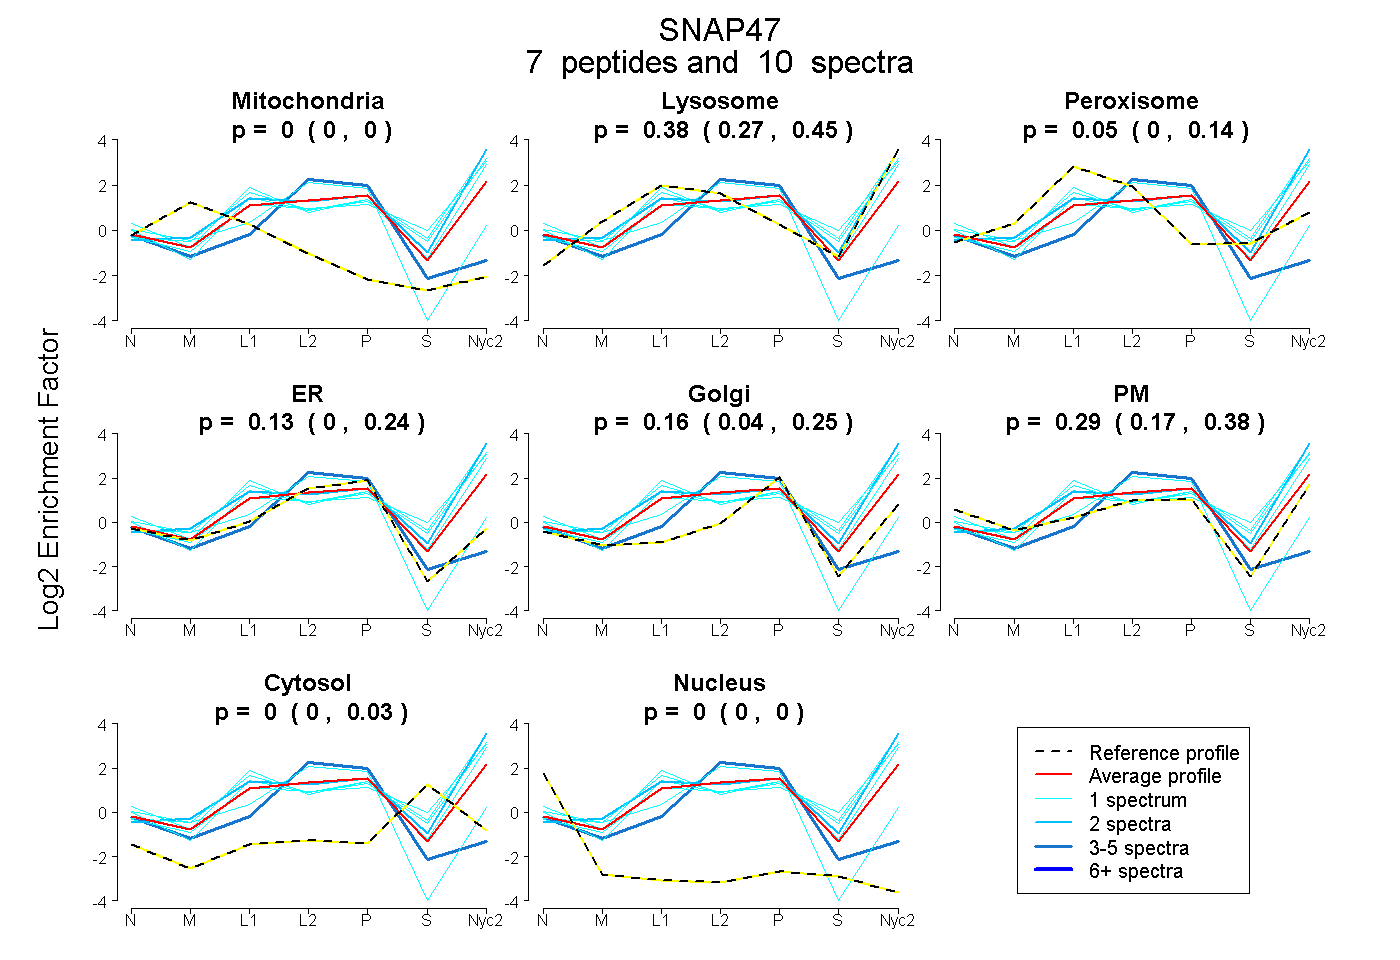
| Expt A |
7 peptides |
10 spectra |
|
0.000 0.000 | 0.000 |
0.381 0.273 | 0.449 |
0.048 0.000 | 0.144 |
0.127 0.000 | 0.236 |
0.155 0.035 | 0.253 |
0.289 0.169 | 0.377 |
0.000 0.000 | 0.030 |
0.000 0.000 | 0.000 |
| 1 spectrum, VPAVVSQR | 0.000 | 0.668 | 0.000 | 0.000 | 0.050 | 0.234 | 0.049 | 0.000 | ||
| 1 spectrum, ASPAEGGCSIR | 0.000 | 0.456 | 0.017 | 0.000 | 0.000 | 0.527 | 0.000 | 0.000 | ||
| 1 spectrum, LTLTPR | 0.000 | 0.000 | 0.000 | 0.842 | 0.000 | 0.158 | 0.000 | 0.000 | ||
| 3 spectra, ATLTVDK | 0.000 | 0.000 | 0.000 | 0.966 | 0.000 | 0.000 | 0.027 | 0.007 | ||
| 1 spectrum, IELLEDALVLR | 0.000 | 0.607 | 0.000 | 0.000 | 0.012 | 0.223 | 0.158 | 0.000 | ||
| 1 spectrum, FIGKPDVAYR | 0.000 | 0.600 | 0.000 | 0.000 | 0.027 | 0.296 | 0.077 | 0.000 | ||
| 2 spectra, MESDLDVADR | 0.000 | 0.687 | 0.000 | 0.000 | 0.105 | 0.208 | 0.000 | 0.000 |
| Plot | Mito | Lyso or Perox | ER | Golgi | PM | Cytosol | Nucleus | ||||||
| Expt B |
2 peptides |
2 spectra |
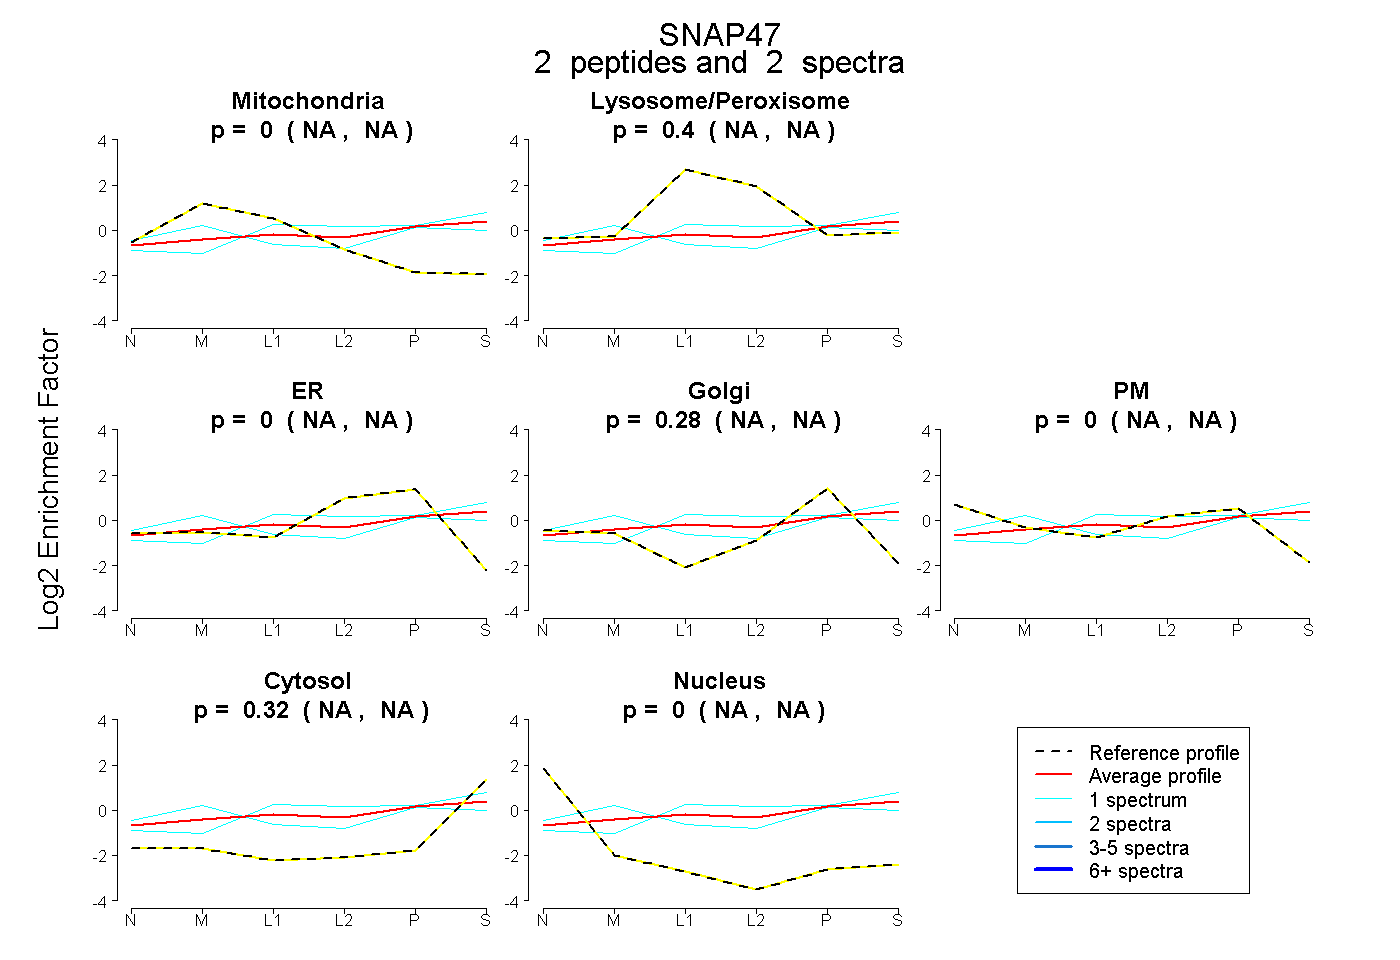 |
0.000 NA | NA |
0.402 NA | NA |
0.000 NA | NA |
0.280 NA | NA |
0.000 NA | NA |
0.318 NA | NA |
0.000 NA | NA |
|||
| Plot | Lyso | Other | |||||||||||
| Expt C |
8 peptides |
26 spectra |
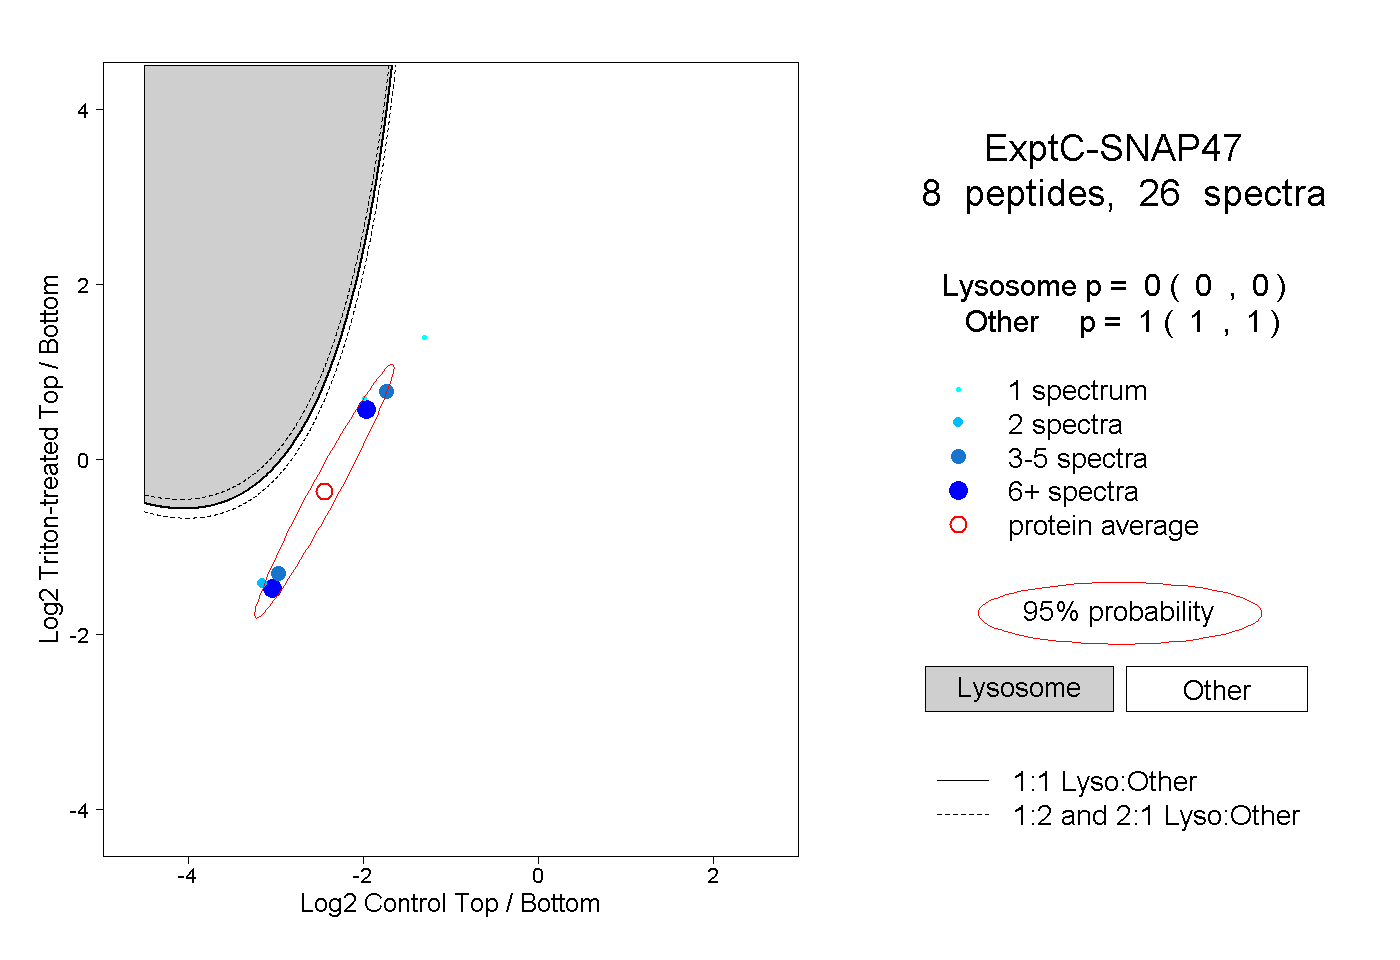 |
0.000 0.000 | 0.000 |
1.000 1.000 | 1.000 |