 20
20peptides
spectra
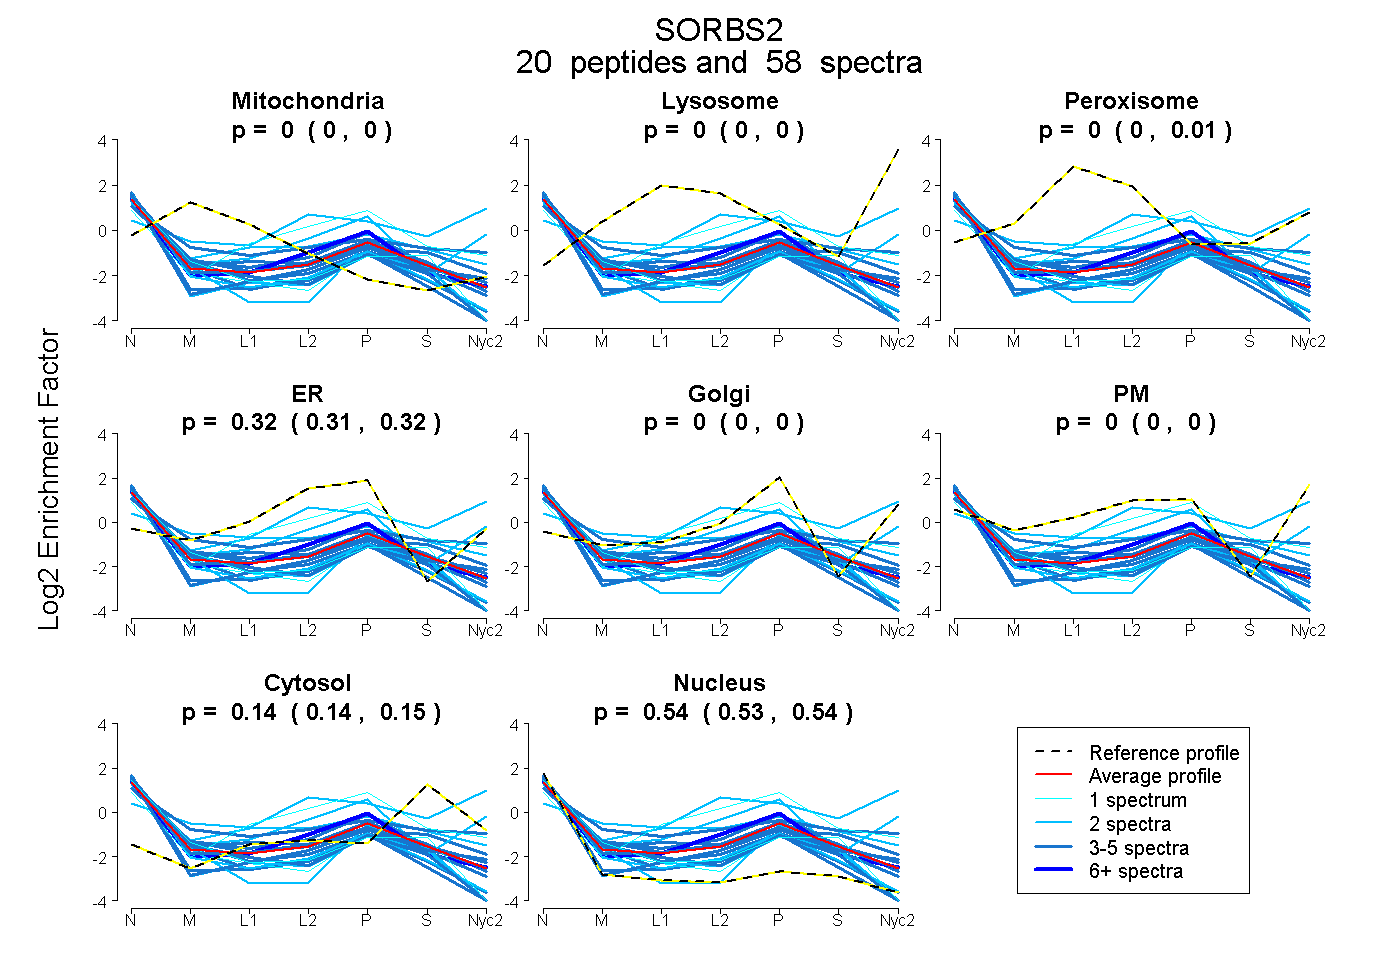
0.000 | 0.000
0.000 | 0.000
0.000 | 0.006
0.309 | 0.322
0.000 | 0.000
0.000 | 0.000
0.136 | 0.148
0.532 | 0.545
6peptides
spectra
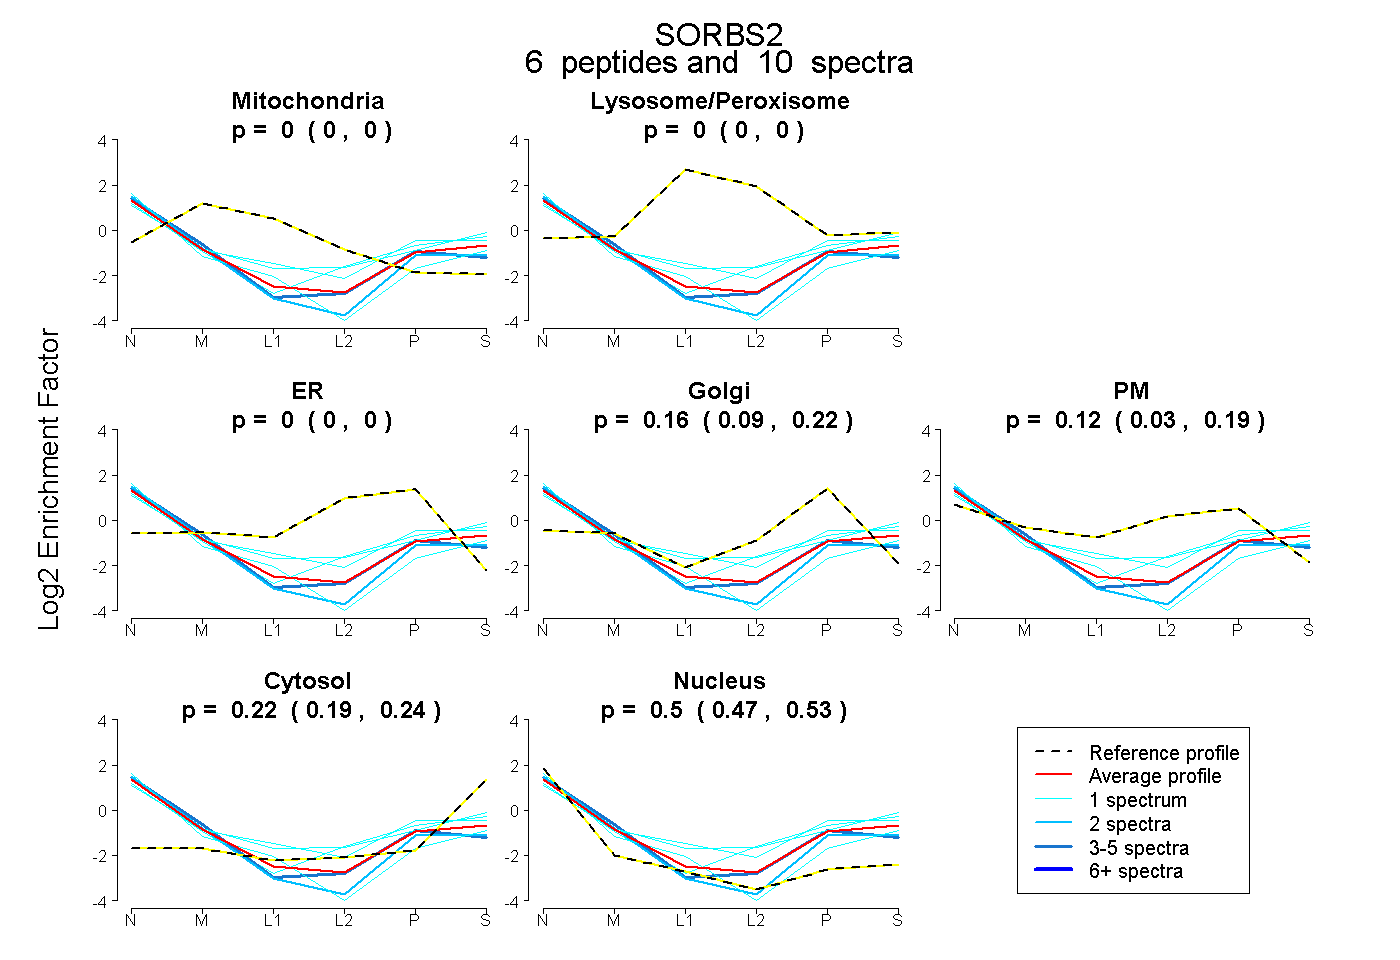
0.000 | 0.000
0.000 | 0.000
0.000 | 0.000
0.094 | 0.220
0.034 | 0.188
0.193 | 0.237
0.472 | 0.528
15peptides
spectra
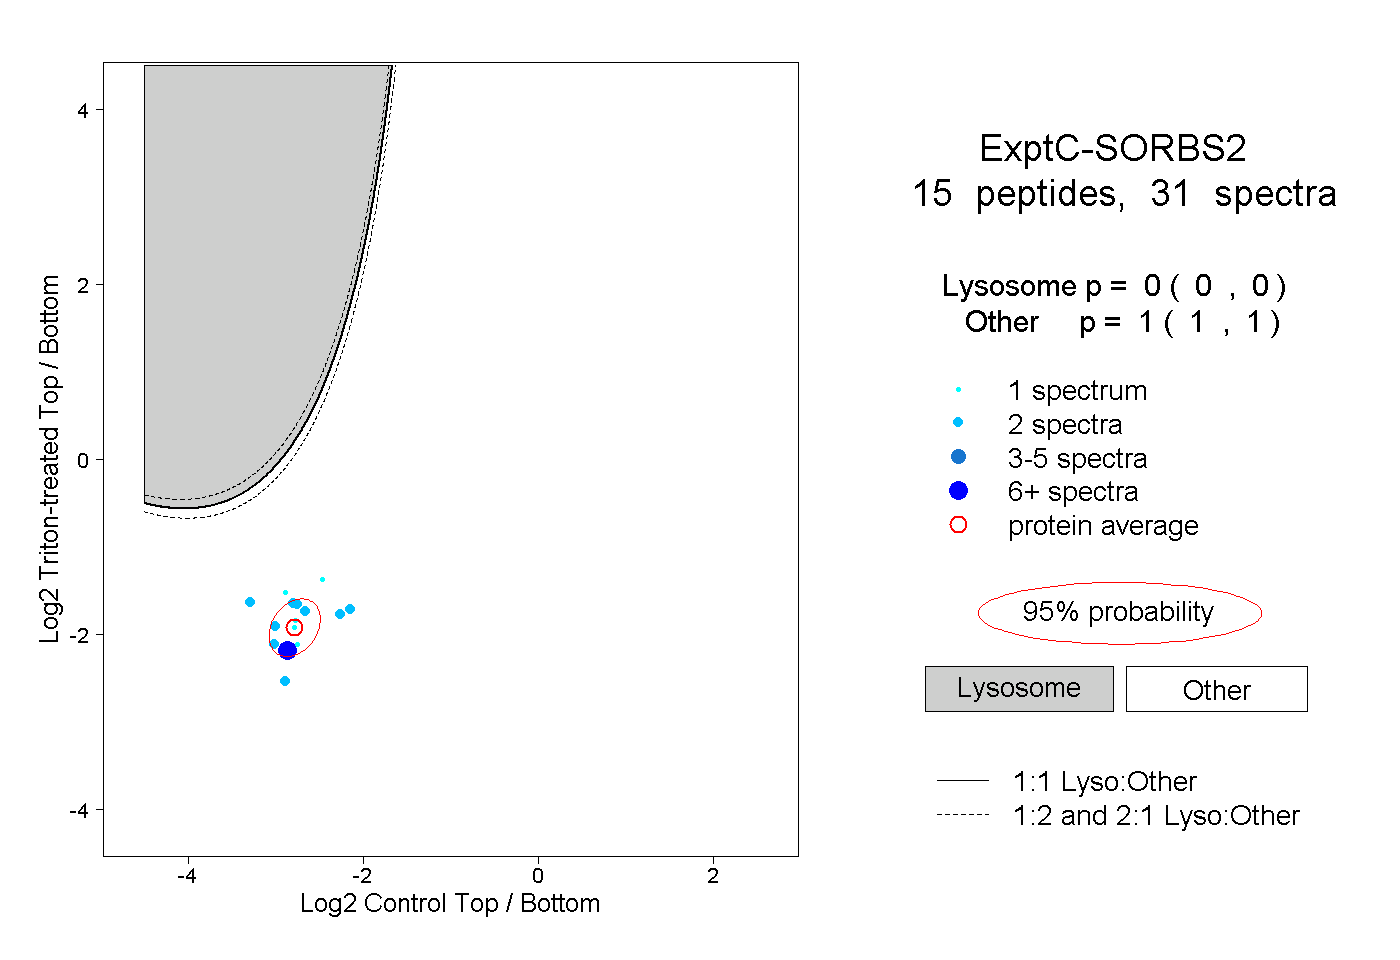
0.000 | 0.000
1.000 | 1.000
2peptides
spectra
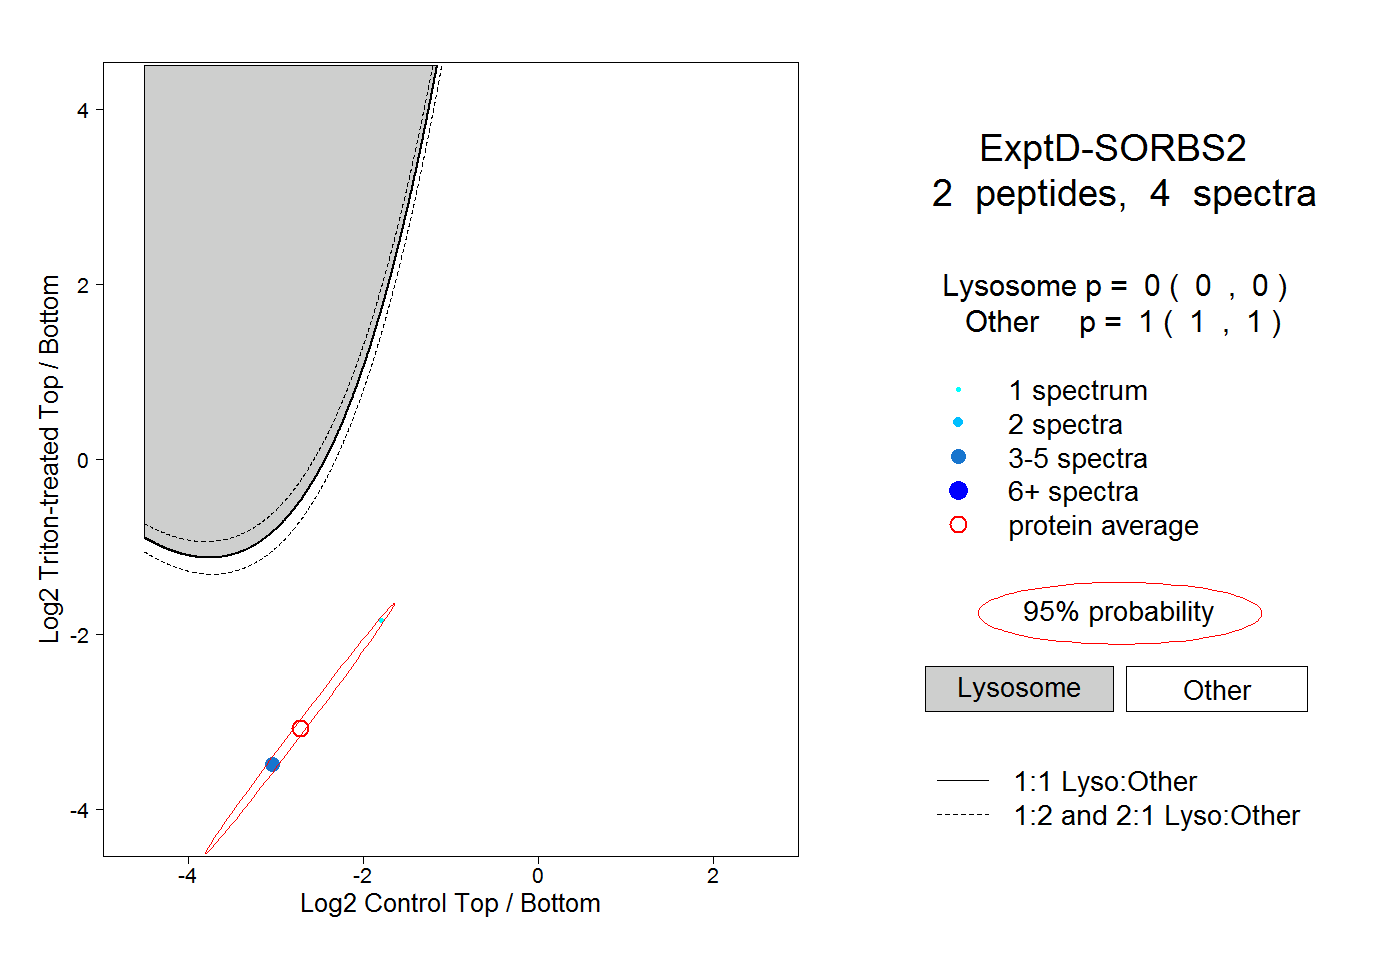
0.000 | 0.000
1.000 | 1.000