 20
20peptides
spectra
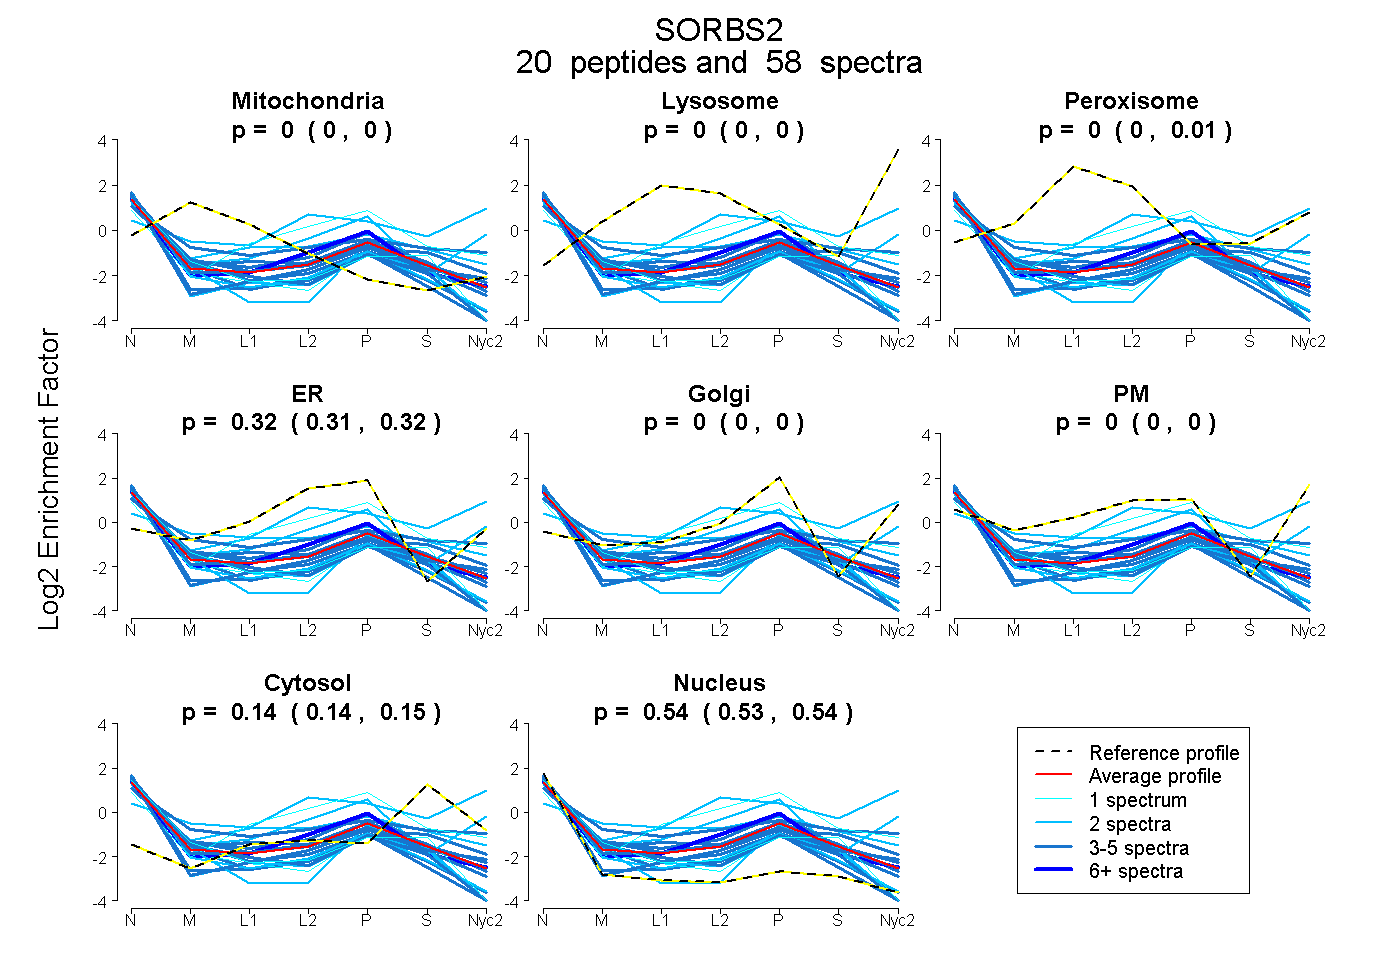
0.000 | 0.000
0.000 | 0.000
0.000 | 0.006
0.309 | 0.322
0.000 | 0.000
0.000 | 0.000
0.136 | 0.148
0.532 | 0.545
| Plot | Mito | Lyso | Perox | ER | Golgi | PM | Cytosol | Nucleus | |||||
| Expt A |
20 peptides |
58 spectra |
|
0.000 0.000 | 0.000 |
0.000 0.000 | 0.000 |
0.000 0.000 | 0.006 |
0.318 0.309 | 0.322 |
0.000 0.000 | 0.000 |
0.000 0.000 | 0.000 |
0.143 0.136 | 0.148 |
0.539 0.532 | 0.545 |
| 4 spectra, TTVDRPK | 0.000 | 0.000 | 0.000 | 0.080 | 0.162 | 0.027 | 0.139 | 0.592 | ||
| 4 spectra, IDQNWYEGEHHGR | 0.092 | 0.000 | 0.033 | 0.000 | 0.000 | 0.375 | 0.254 | 0.246 | ||
| 4 spectra, HDWDPPDR | 0.062 | 0.000 | 0.000 | 0.304 | 0.000 | 0.000 | 0.134 | 0.501 | ||
| 1 spectrum, YNFNADTNVELSLR | 0.133 | 0.000 | 0.000 | 0.077 | 0.000 | 0.000 | 0.162 | 0.629 | ||
| 3 spectra, VGIFPISYVEK | 0.130 | 0.000 | 0.000 | 0.136 | 0.000 | 0.000 | 0.028 | 0.706 | ||
| 1 spectrum, SHSDNGTDAFK | 0.000 | 0.000 | 0.000 | 0.550 | 0.000 | 0.016 | 0.298 | 0.136 | ||
| 2 spectra, SEPAVGPPR | 0.000 | 0.000 | 0.000 | 0.229 | 0.000 | 0.000 | 0.009 | 0.762 | ||
| 3 spectra, QGIFPVSYVEVVK | 0.084 | 0.000 | 0.000 | 0.215 | 0.007 | 0.000 | 0.086 | 0.608 | ||
| 2 spectra, EAPSPVPPPHVPPRPR | 0.000 | 0.000 | 0.052 | 0.000 | 0.000 | 0.623 | 0.325 | 0.000 | ||
| 3 spectra, ESDVVDVMEK | 0.000 | 0.000 | 0.000 | 0.182 | 0.000 | 0.000 | 0.024 | 0.794 | ||
| 3 spectra, AQPARPPPPVQPGEIGEAIAK | 0.038 | 0.000 | 0.000 | 0.191 | 0.000 | 0.000 | 0.000 | 0.771 | ||
| 5 spectra, LLLLK | 0.027 | 0.000 | 0.000 | 0.381 | 0.009 | 0.000 | 0.141 | 0.441 | ||
| 8 spectra, NEDELELR | 0.000 | 0.000 | 0.000 | 0.417 | 0.000 | 0.000 | 0.056 | 0.527 | ||
| 2 spectra, AAMSVTLTSVK | 0.000 | 0.000 | 0.173 | 0.216 | 0.000 | 0.086 | 0.186 | 0.340 | ||
| 2 spectra, AVYDFK | 0.000 | 0.000 | 0.000 | 0.008 | 0.246 | 0.427 | 0.049 | 0.269 | ||
| 2 spectra, SIFEYEPGK | 0.000 | 0.000 | 0.000 | 0.000 | 0.146 | 0.000 | 0.052 | 0.801 | ||
| 3 spectra, APHYPGIGPVDESGIPTAIR | 0.000 | 0.000 | 0.119 | 0.071 | 0.000 | 0.127 | 0.207 | 0.476 | ||
| 2 spectra, TQTYRPLSK | 0.000 | 0.000 | 0.000 | 0.103 | 0.000 | 0.000 | 0.125 | 0.772 | ||
| 3 spectra, SLERPSSSASMAGDFR | 0.000 | 0.000 | 0.026 | 0.280 | 0.000 | 0.000 | 0.127 | 0.567 | ||
| 1 spectrum, FFGTFPGNYVK | 0.028 | 0.000 | 0.000 | 0.137 | 0.000 | 0.000 | 0.076 | 0.759 |
| Plot | Mito | Lyso or Perox | ER | Golgi | PM | Cytosol | Nucleus | ||||||
| Expt B |
6 peptides |
10 spectra |
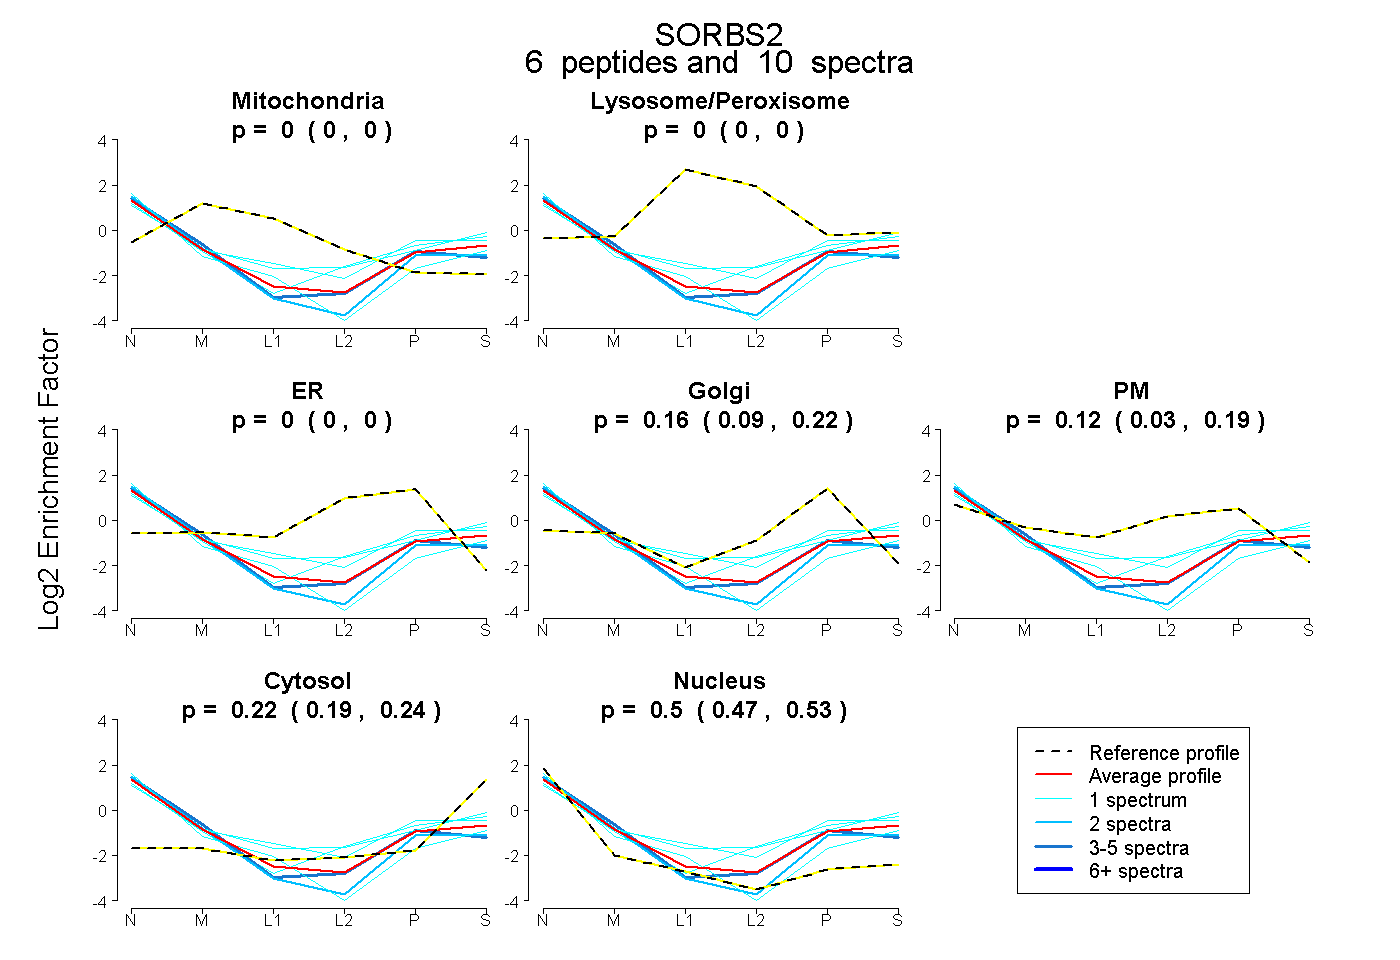 |
0.000 0.000 | 0.000 |
0.000 0.000 | 0.000 |
0.000 0.000 | 0.000 |
0.165 0.094 | 0.220 |
0.116 0.034 | 0.188 |
0.216 0.193 | 0.237 |
0.503 0.472 | 0.528 |
|||
| Plot | Lyso | Other | |||||||||||
| Expt C |
15 peptides |
31 spectra |
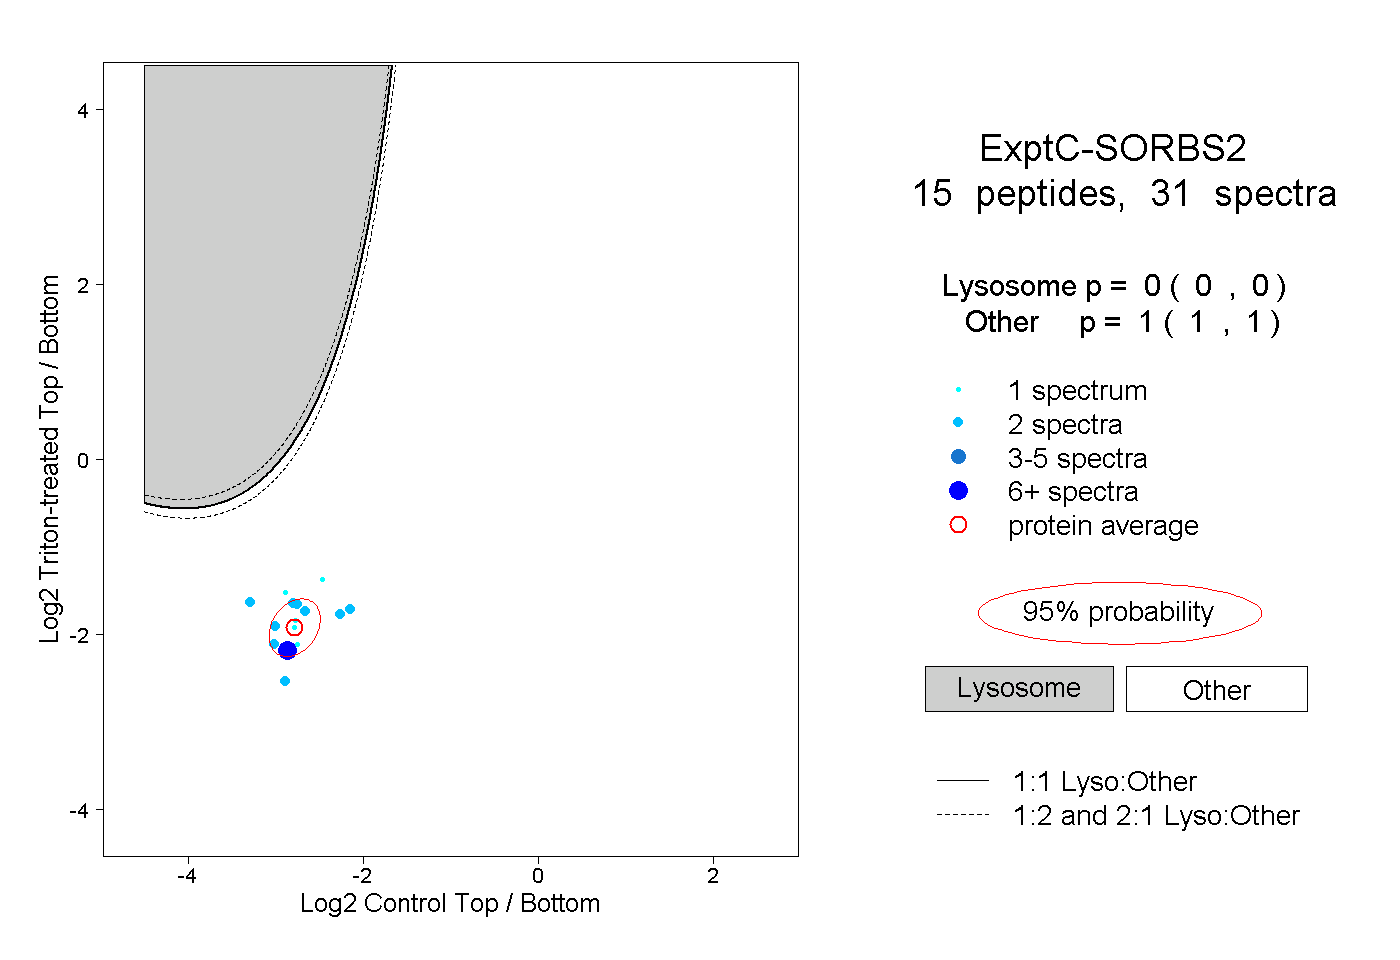 |
0.000 0.000 | 0.000 |
1.000 1.000 | 1.000 |
||||||||
| Plot | Lyso | Other | |||||||||||
| Expt D |
2 peptides |
4 spectra |
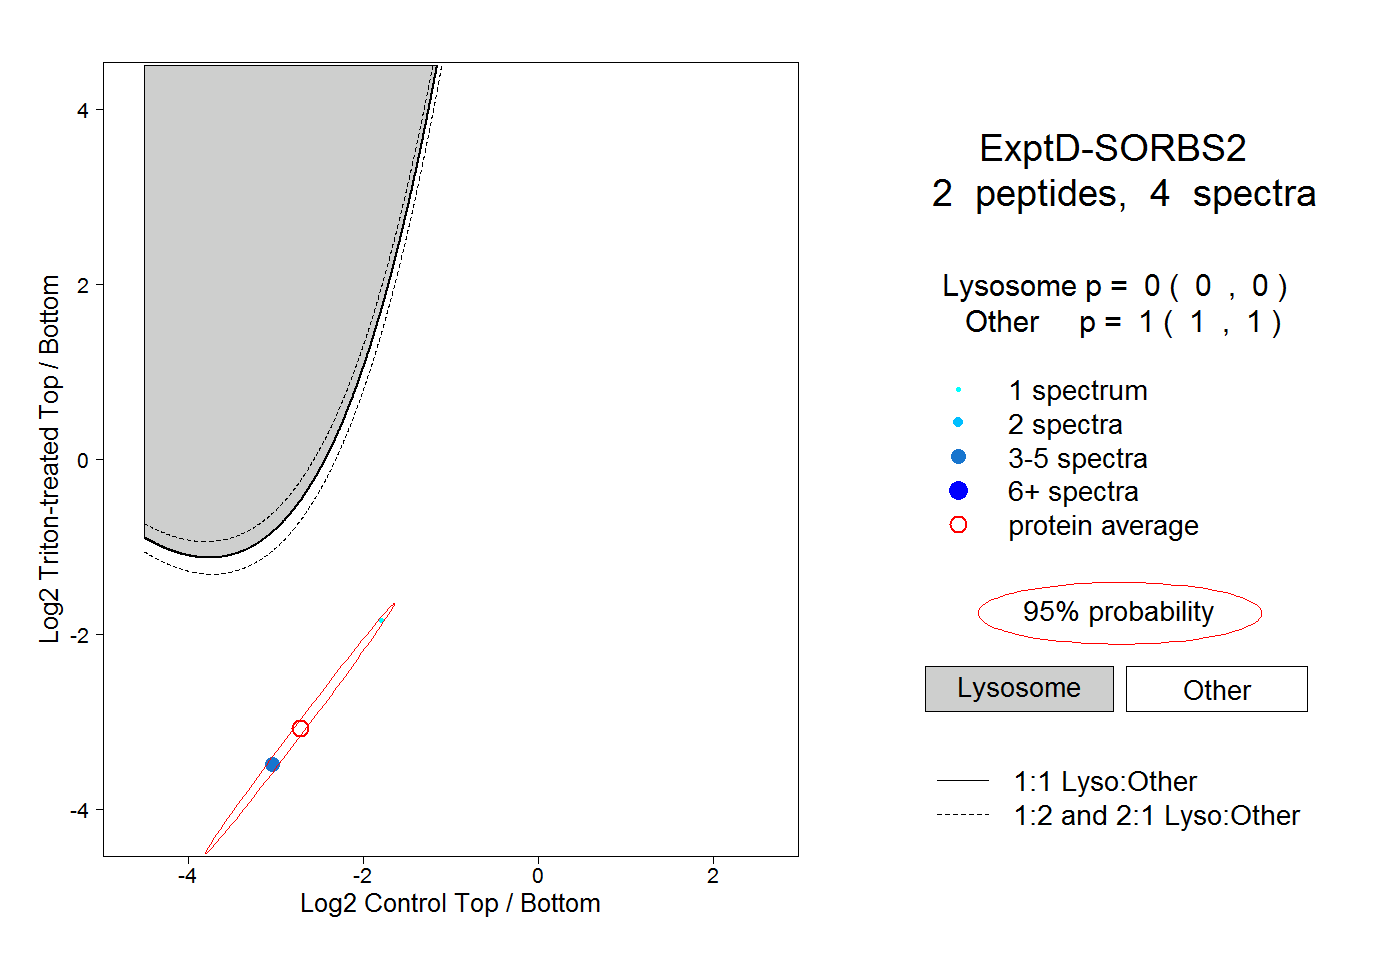 |
0.000 0.000 | 0.000 |
1.000 1.000 | 1.000 |