 13
13peptides
spectra
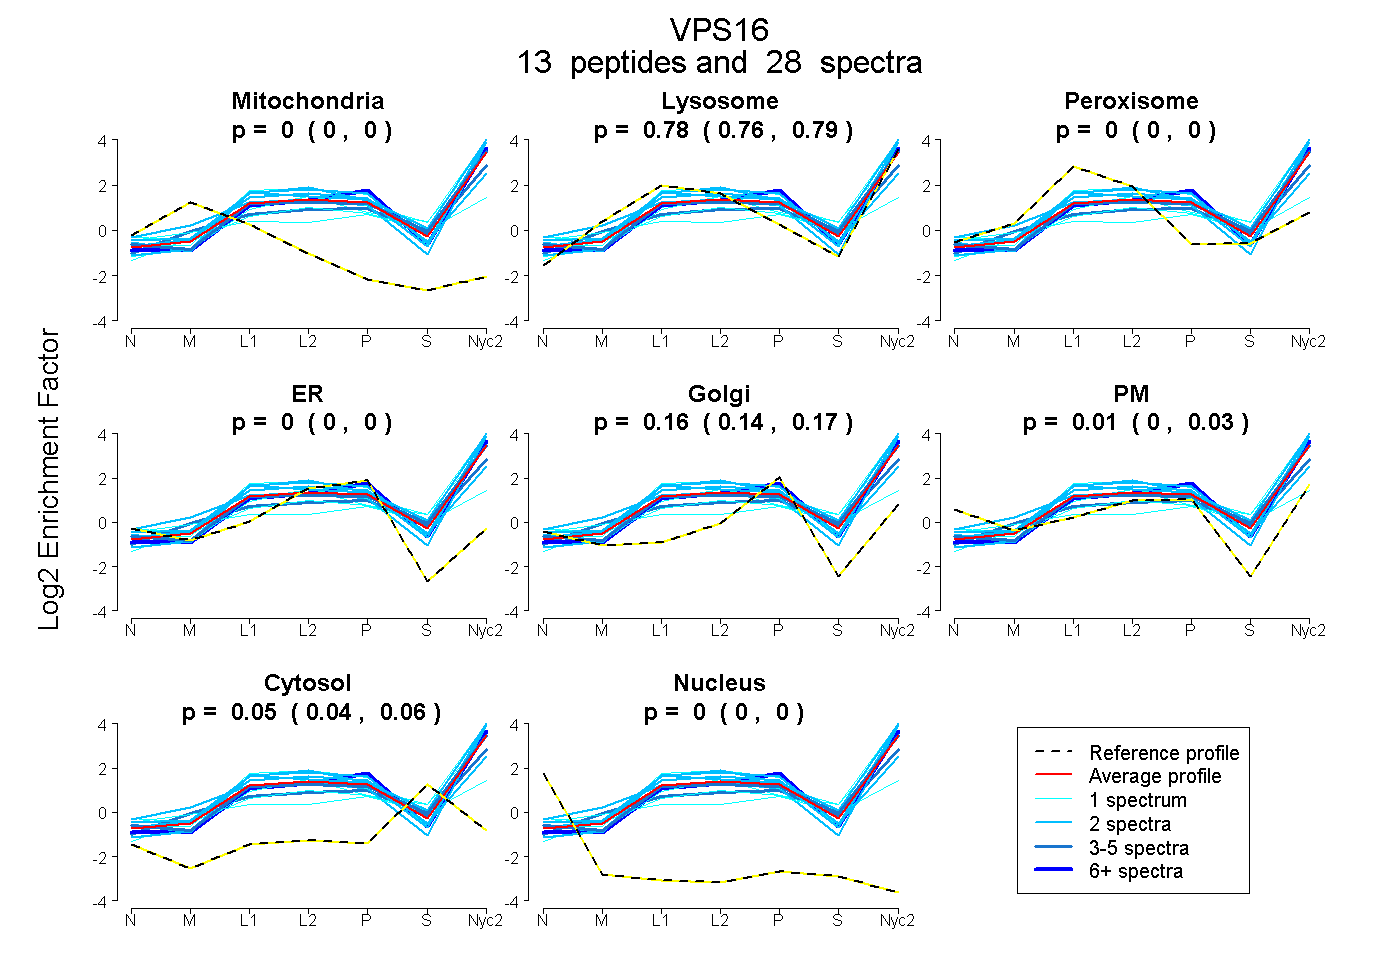
0.000 | 0.000
0.764 | 0.786
0.000 | 0.000
0.000 | 0.000
0.142 | 0.174
0.000 | 0.029
0.043 | 0.057
0.000 | 0.000
6peptides
spectra
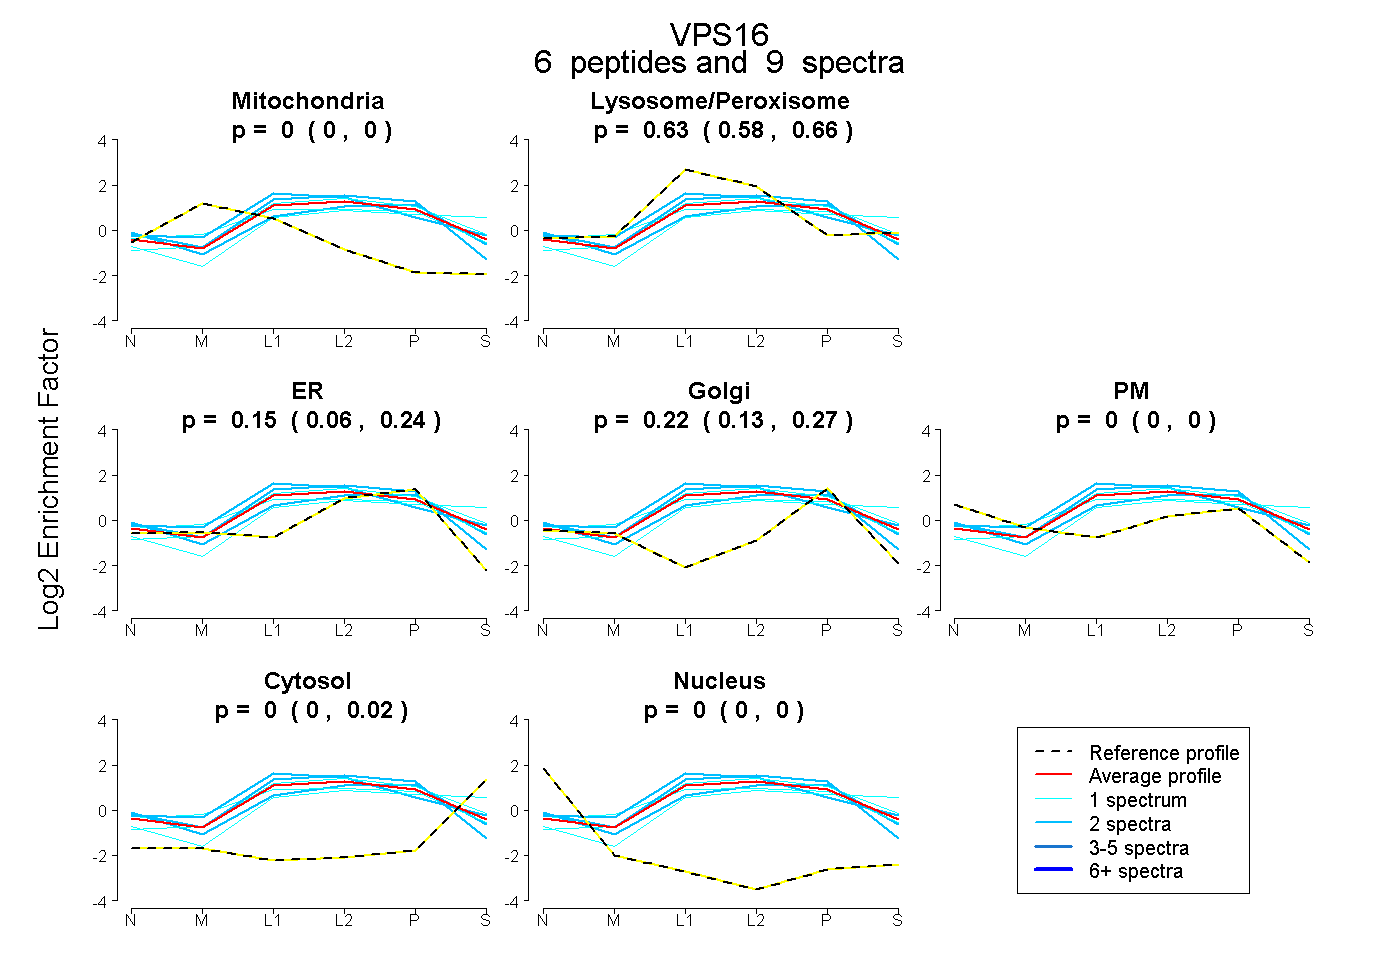
0.000 | 0.000
0.578 | 0.658
0.063 | 0.243
0.135 | 0.271
0.000 | 0.000
0.000 | 0.022
0.000 | 0.000
26peptides
spectra
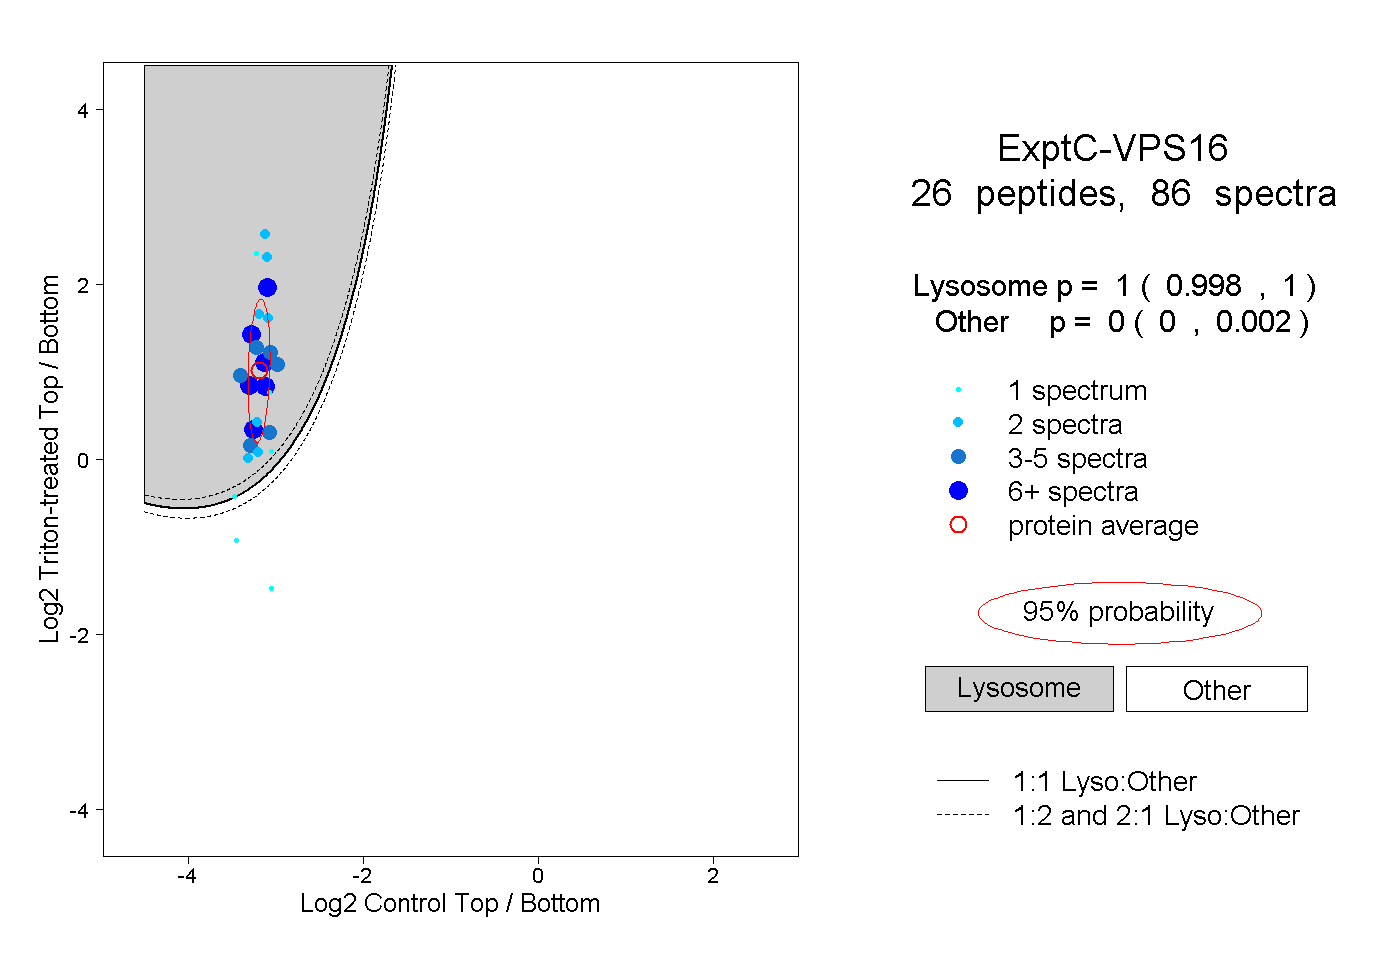
0.998 | 1.000
0.000 | 0.002
8peptides
spectra
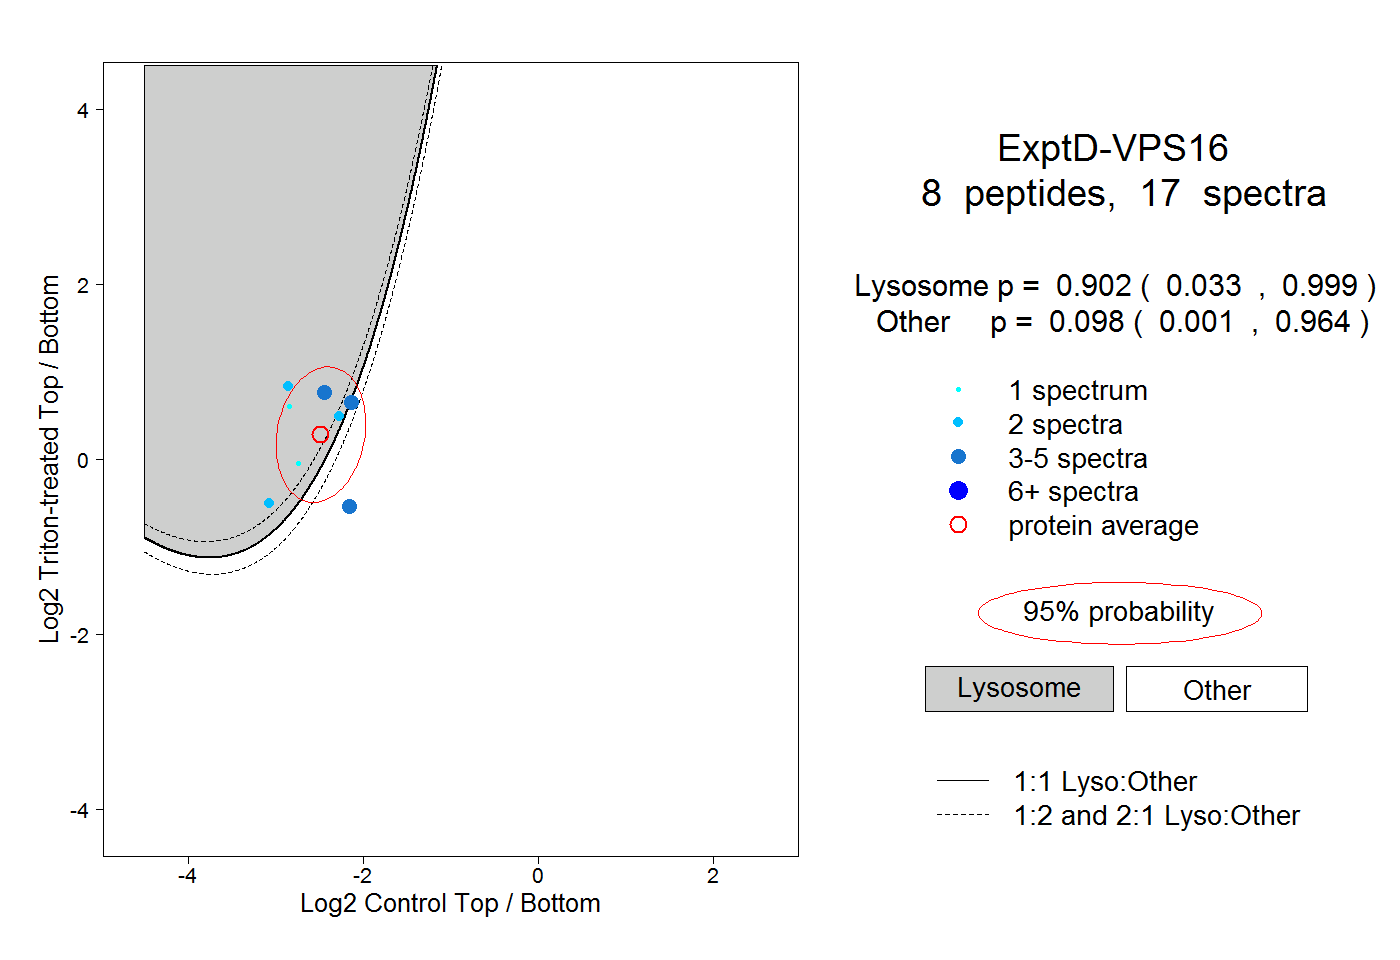
0.033 | 0.999
0.001 | 0.964