 13
13peptides
spectra
0.000 | 0.000
0.764 | 0.786
0.000 | 0.000
0.000 | 0.000
0.142 | 0.174
0.000 | 0.029
0.043 | 0.057
0.000 | 0.000
| Plot | Mito | Lyso | Perox | ER | Golgi | PM | Cytosol | Nucleus | |||||
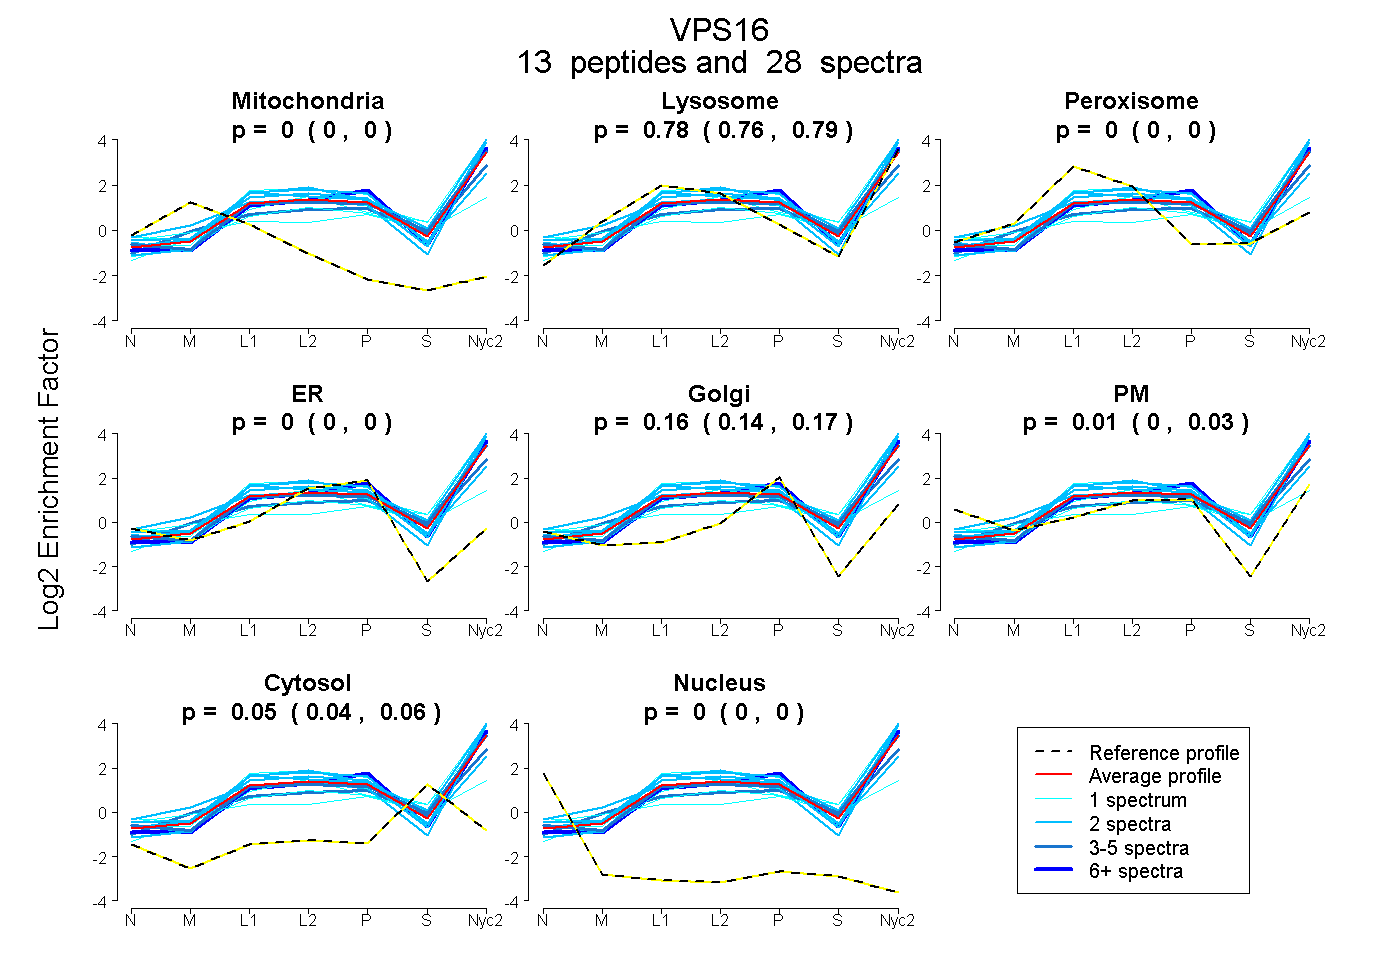
| Expt A |
13 peptides |
28 spectra |
|
0.000 0.000 | 0.000 |
0.777 0.764 | 0.786 |
0.000 0.000 | 0.000 |
0.000 0.000 | 0.000 |
0.160 0.142 | 0.174 |
0.013 0.000 | 0.029 |
0.051 0.043 | 0.057 |
0.000 0.000 | 0.000 |
| 2 spectra, LGDTPGVSYSDIAAR | 0.000 | 0.902 | 0.000 | 0.000 | 0.037 | 0.000 | 0.062 | 0.000 | ||
| 2 spectra, AVVVAWER | 0.000 | 0.715 | 0.000 | 0.000 | 0.000 | 0.285 | 0.000 | 0.000 | ||
| 1 spectrum, AIESGDTDLVFTVLLHLK | 0.000 | 0.836 | 0.000 | 0.000 | 0.000 | 0.000 | 0.164 | 0.000 | ||
| 2 spectra, GDFFMTLR | 0.000 | 0.806 | 0.000 | 0.000 | 0.061 | 0.133 | 0.000 | 0.000 | ||
| 2 spectra, LCEFNCNIR | 0.000 | 0.642 | 0.060 | 0.170 | 0.096 | 0.000 | 0.032 | 0.000 | ||
| 4 spectra, QMVWCSRPR | 0.000 | 0.744 | 0.000 | 0.000 | 0.097 | 0.054 | 0.104 | 0.000 | ||
| 6 spectra, ATEDQMR | 0.000 | 0.723 | 0.000 | 0.000 | 0.277 | 0.000 | 0.000 | 0.000 | ||
| 1 spectrum, ILAHWACYK | 0.000 | 0.308 | 0.129 | 0.000 | 0.162 | 0.148 | 0.253 | 0.000 | ||
| 1 spectrum, ASYAAEER | 0.000 | 0.636 | 0.000 | 0.000 | 0.000 | 0.204 | 0.160 | 0.000 | ||
| 3 spectra, ALLLVGDVAQAADVAIEHR | 0.000 | 0.692 | 0.000 | 0.000 | 0.170 | 0.000 | 0.138 | 0.000 | ||
| 1 spectrum, DVSDEDVAR | 0.000 | 0.850 | 0.000 | 0.000 | 0.046 | 0.105 | 0.000 | 0.000 | ||
| 2 spectra, QLTIQVLLDR | 0.000 | 0.808 | 0.000 | 0.000 | 0.000 | 0.192 | 0.000 | 0.000 | ||
| 1 spectrum, FTLSANVGDLK | 0.000 | 0.849 | 0.000 | 0.000 | 0.016 | 0.000 | 0.136 | 0.000 |
| Plot | Mito | Lyso or Perox | ER | Golgi | PM | Cytosol | Nucleus | ||||||
| Expt B |
6 peptides |
9 spectra |
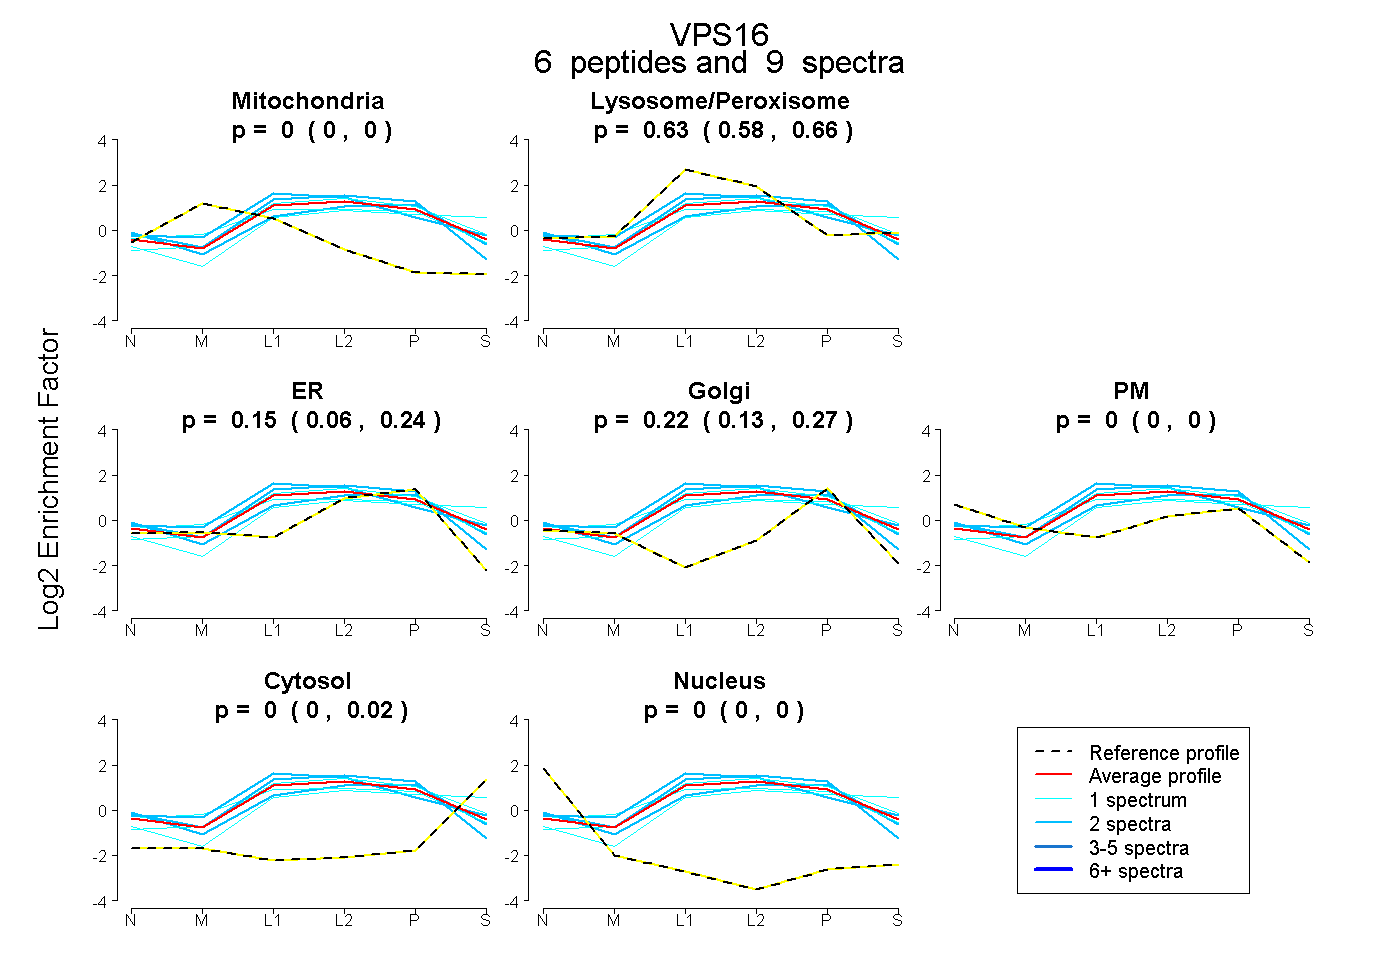 |
0.000 0.000 | 0.000 |
0.627 0.578 | 0.658 |
0.148 0.063 | 0.243 |
0.225 0.135 | 0.271 |
0.000 0.000 | 0.000 |
0.000 0.000 | 0.022 |
0.000 0.000 | 0.000 |
|||
| Plot | Lyso | Other | |||||||||||
| Expt C |
26 peptides |
86 spectra |
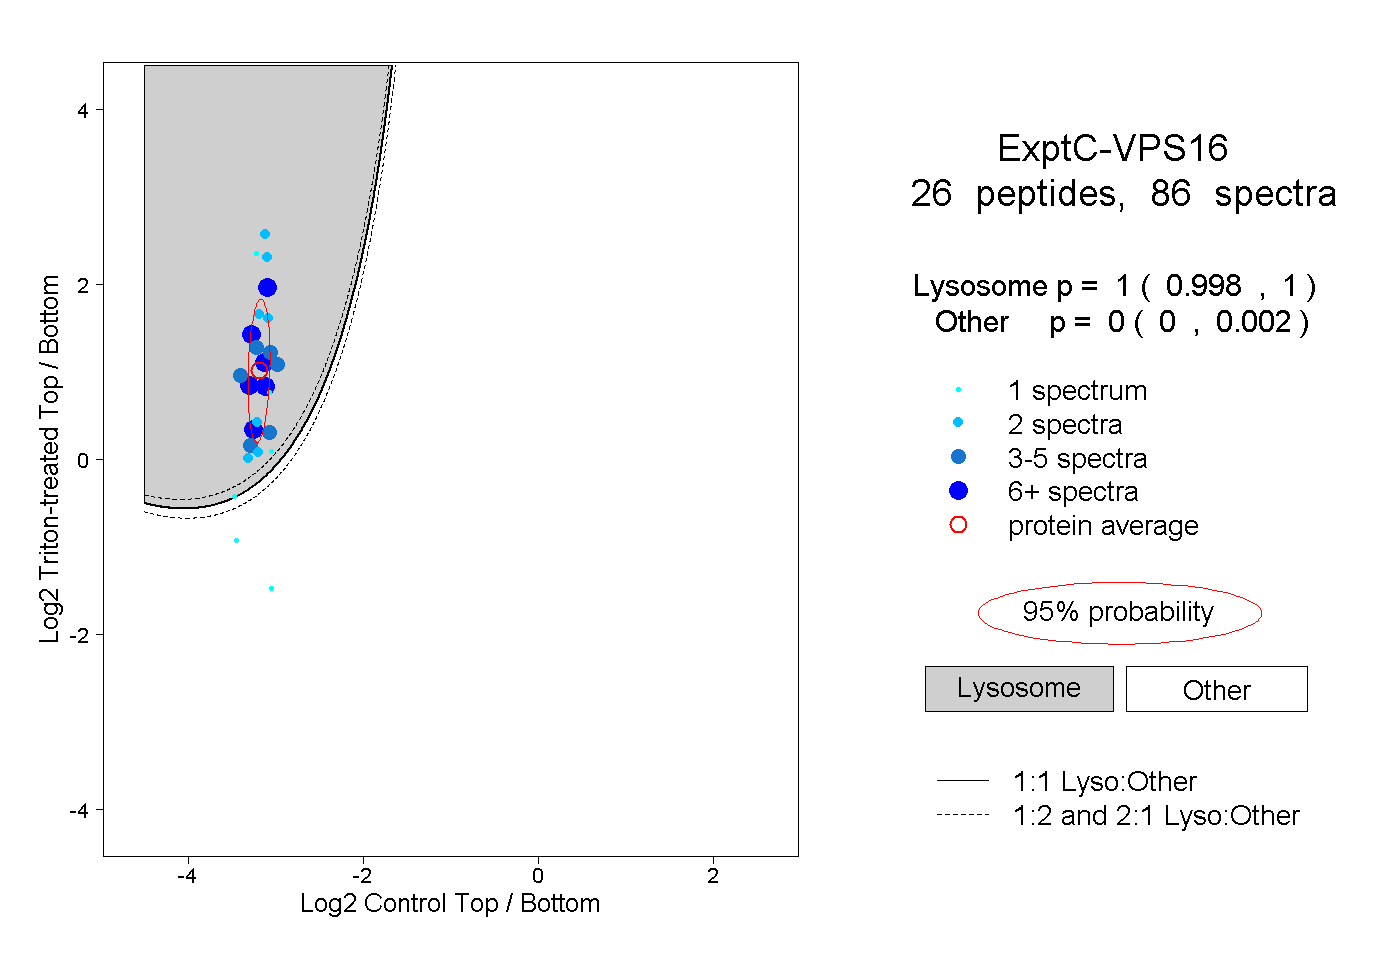 |
1.000 0.998 | 1.000 |
0.000 0.000 | 0.002 |
||||||||
| Plot | Lyso | Other | |||||||||||
| Expt D |
8 peptides |
17 spectra |
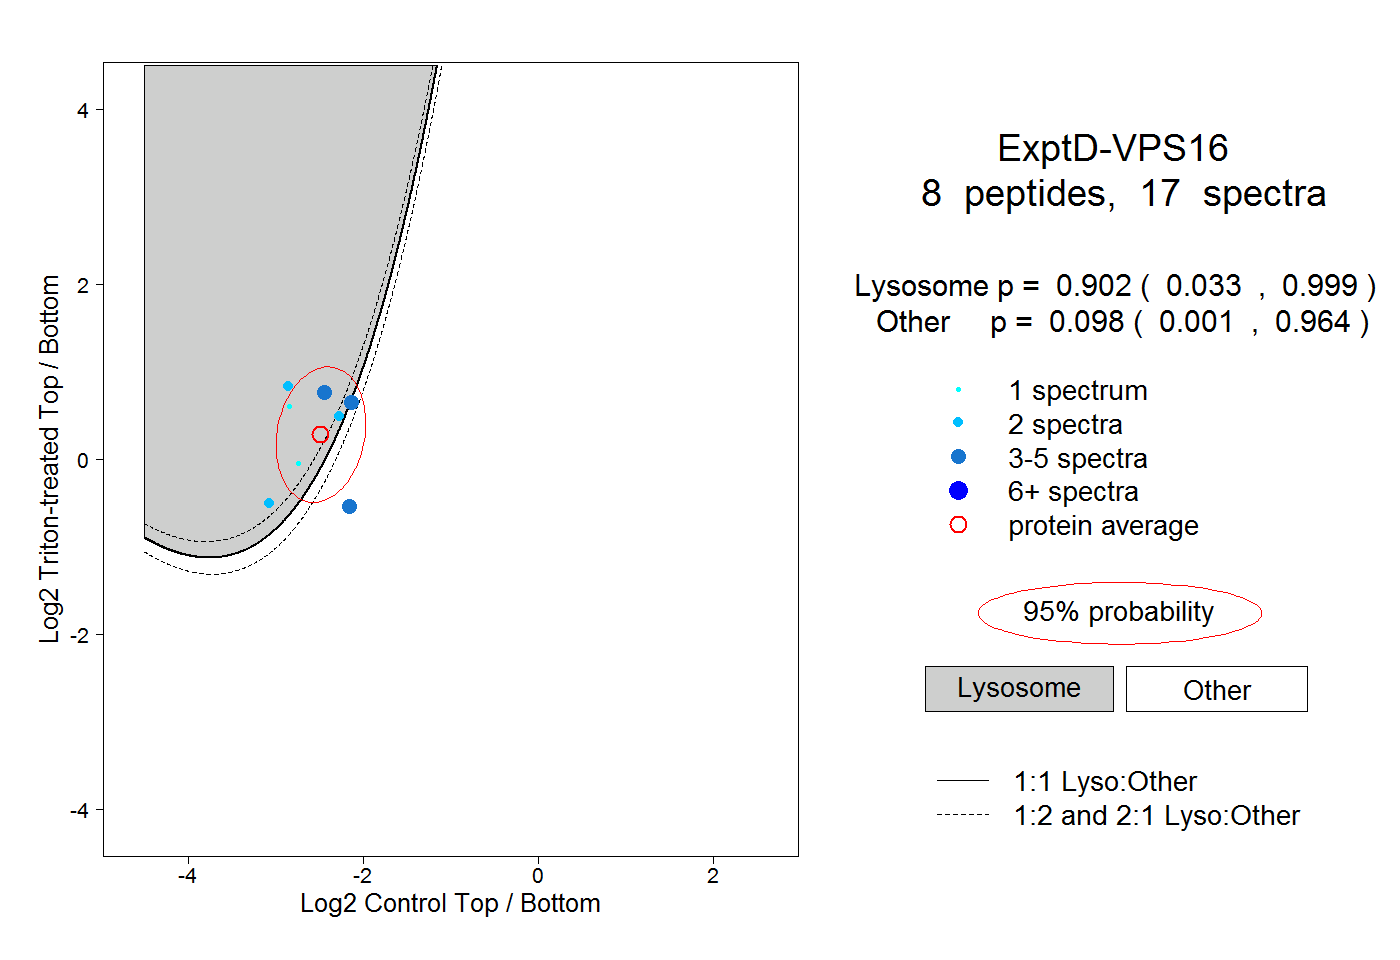 |
0.902 0.033 | 0.999 |
0.098 0.001 | 0.964 |