 5
5peptides
spectra
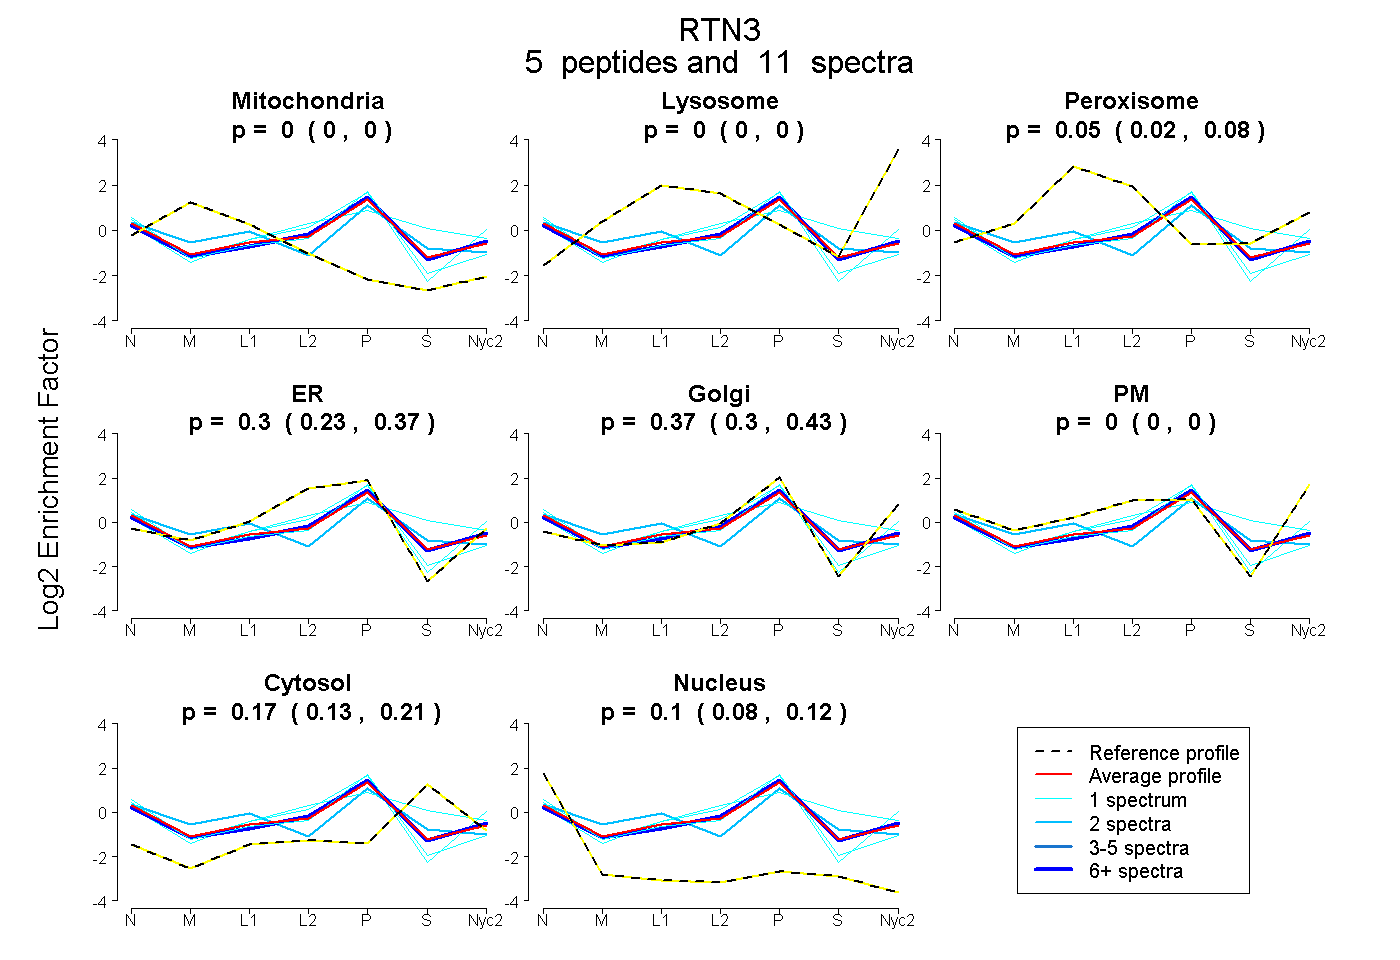
0.000 | 0.000
0.000 | 0.000
0.024 | 0.078
0.225 | 0.370
0.300 | 0.425
0.000 | 0.000
0.135 | 0.207
0.079 | 0.120
2peptides
spectra
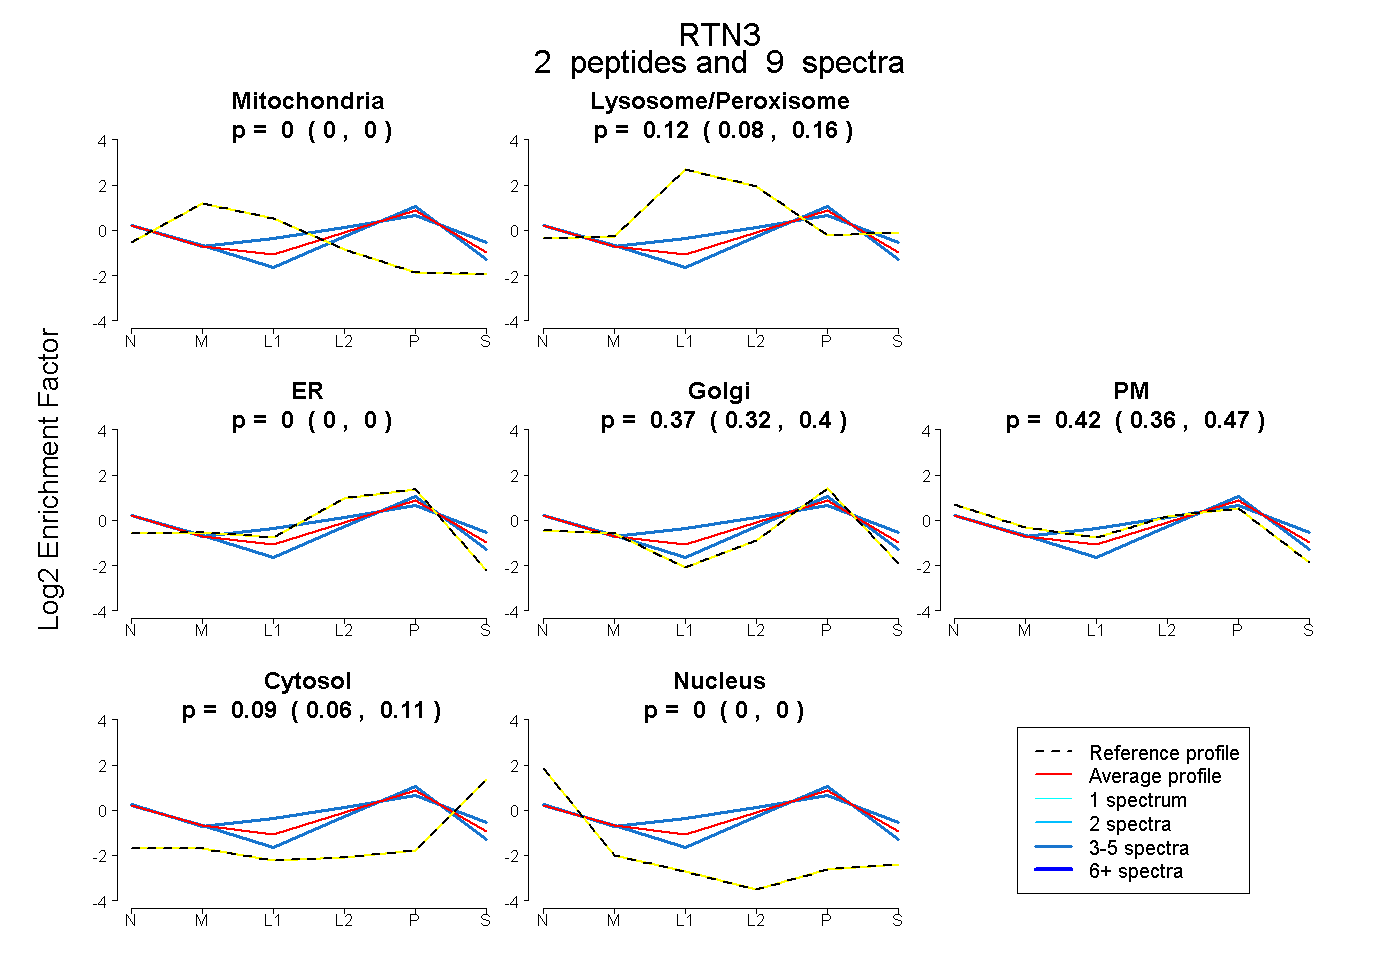
0.000 | 0.000
0.075 | 0.162
0.000 | 0.000
0.322 | 0.402
0.363 | 0.470
0.062 | 0.113
0.000 | 0.000
3peptides
spectra
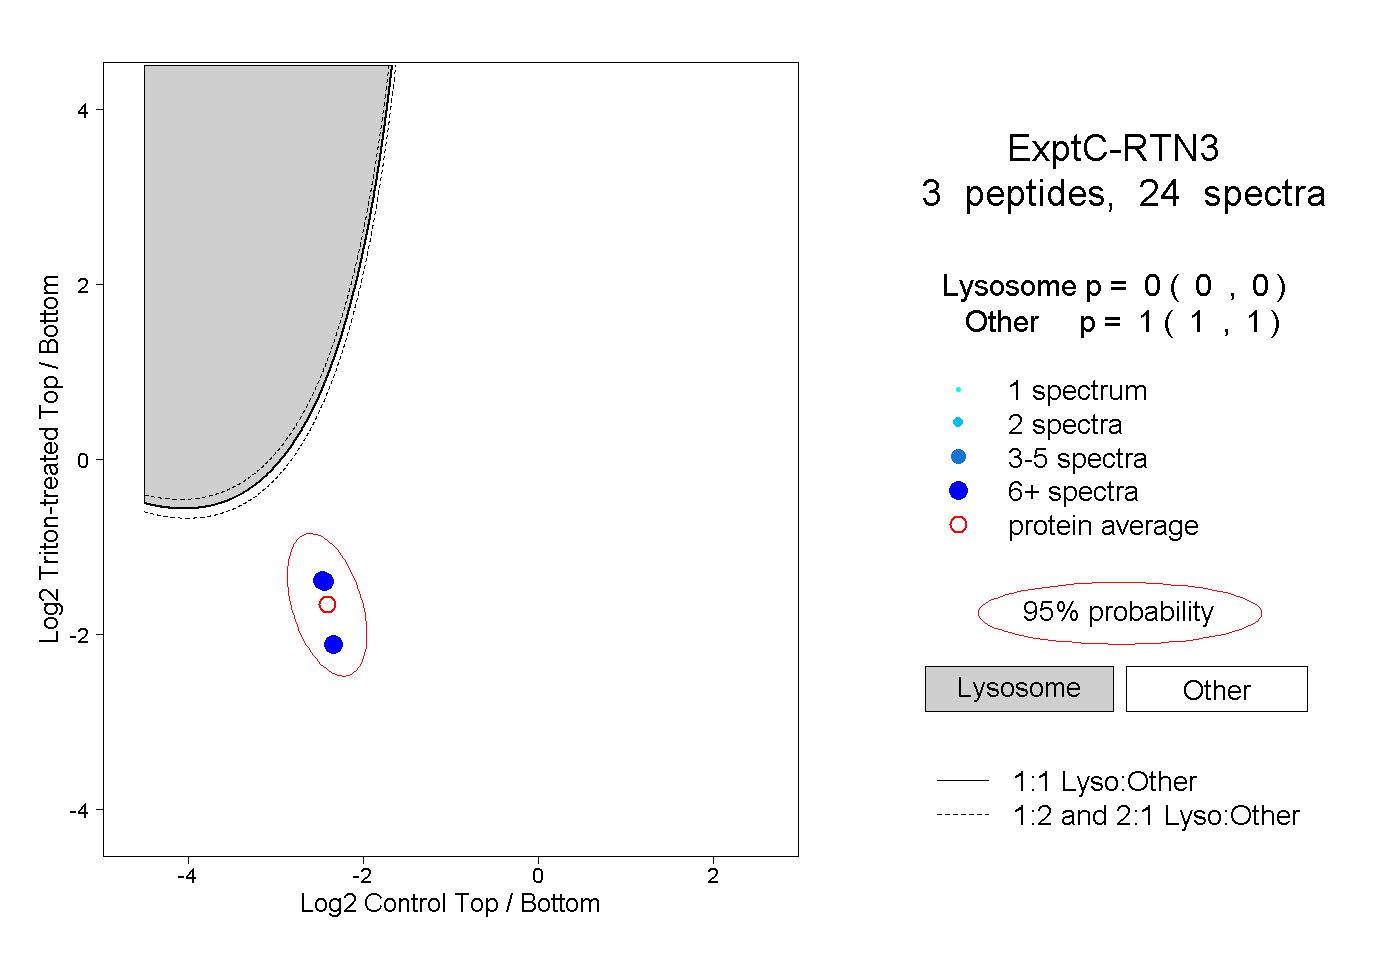
0.000 | 0.000
1.000 | 1.000