 5
5peptides
spectra
0.000 | 0.000
0.000 | 0.000
0.024 | 0.078
0.225 | 0.370
0.300 | 0.425
0.000 | 0.000
0.135 | 0.207
0.079 | 0.120
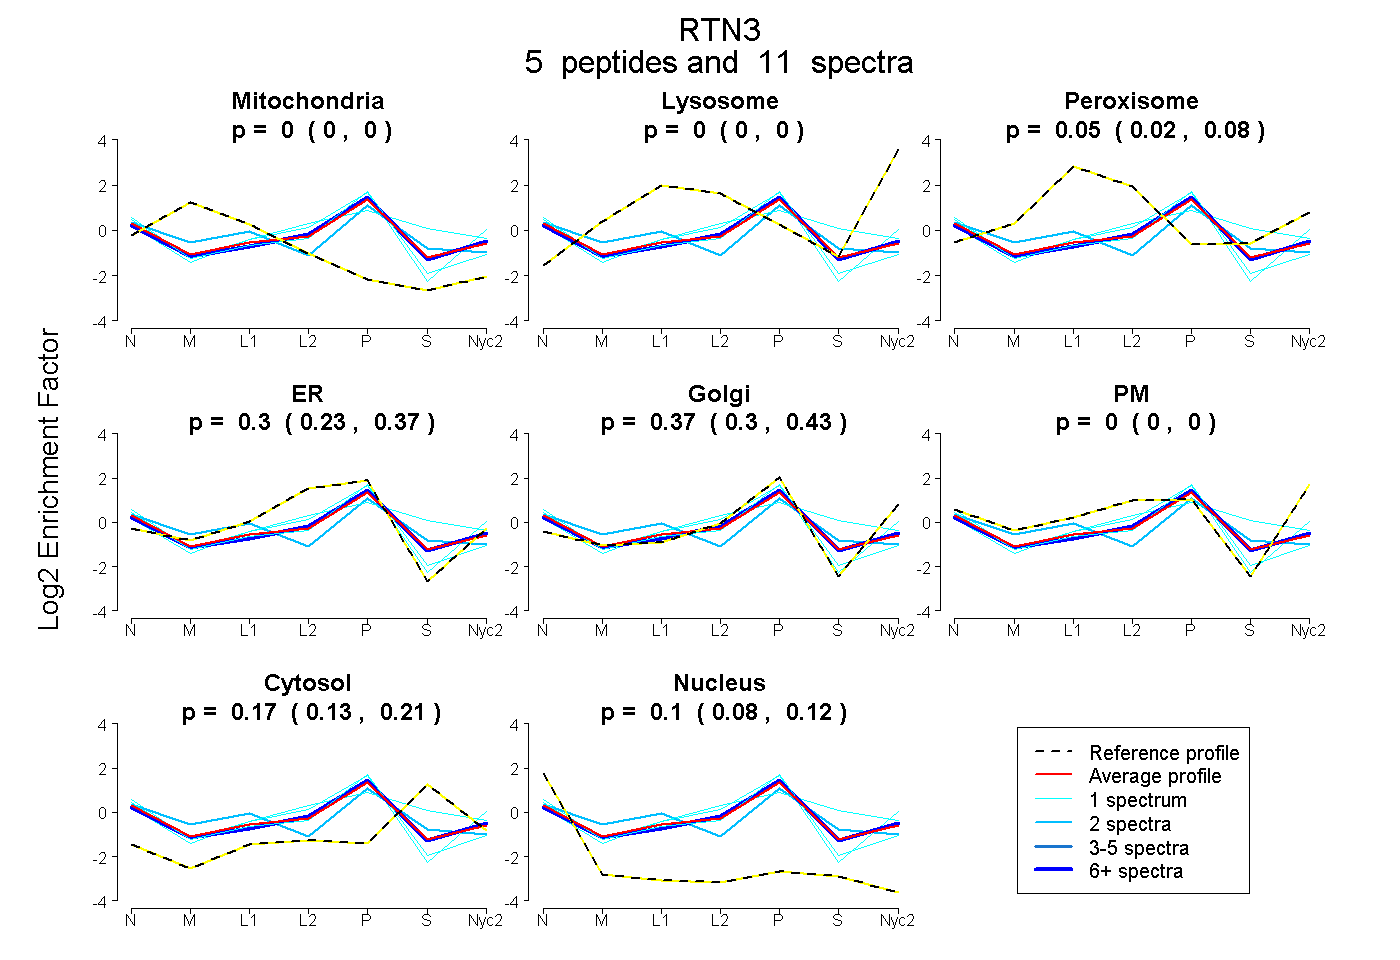
| Plot | Mito | Lyso | Perox | ER | Golgi | PM | Cytosol | Nucleus | |||||
| Expt A |
5 peptides |
11 spectra |
|
0.000 0.000 | 0.000 |
0.000 0.000 | 0.000 |
0.054 0.024 | 0.078 |
0.305 0.225 | 0.370 |
0.367 0.300 | 0.425 |
0.000 0.000 | 0.000 |
0.174 0.135 | 0.207 |
0.100 0.079 | 0.120 |
| 1 spectrum, LPGIAK | 0.000 | 0.000 | 0.000 | 0.298 | 0.400 | 0.190 | 0.000 | 0.113 | ||
| 2 spectra, SCGSSCAVHDLIFWR | 0.151 | 0.000 | 0.111 | 0.016 | 0.460 | 0.000 | 0.180 | 0.080 | ||
| 1 spectrum, TQIDHYVGIAR | 0.000 | 0.000 | 0.000 | 0.436 | 0.338 | 0.000 | 0.041 | 0.186 | ||
| 1 spectrum, SEEGHPFK | 0.000 | 0.000 | 0.042 | 0.359 | 0.000 | 0.155 | 0.444 | 0.000 | ||
| 6 spectra, SVLQAVQK | 0.000 | 0.000 | 0.000 | 0.347 | 0.379 | 0.000 | 0.195 | 0.079 |
| Plot | Mito | Lyso or Perox | ER | Golgi | PM | Cytosol | Nucleus | ||||||
| Expt B |
2 peptides |
9 spectra |
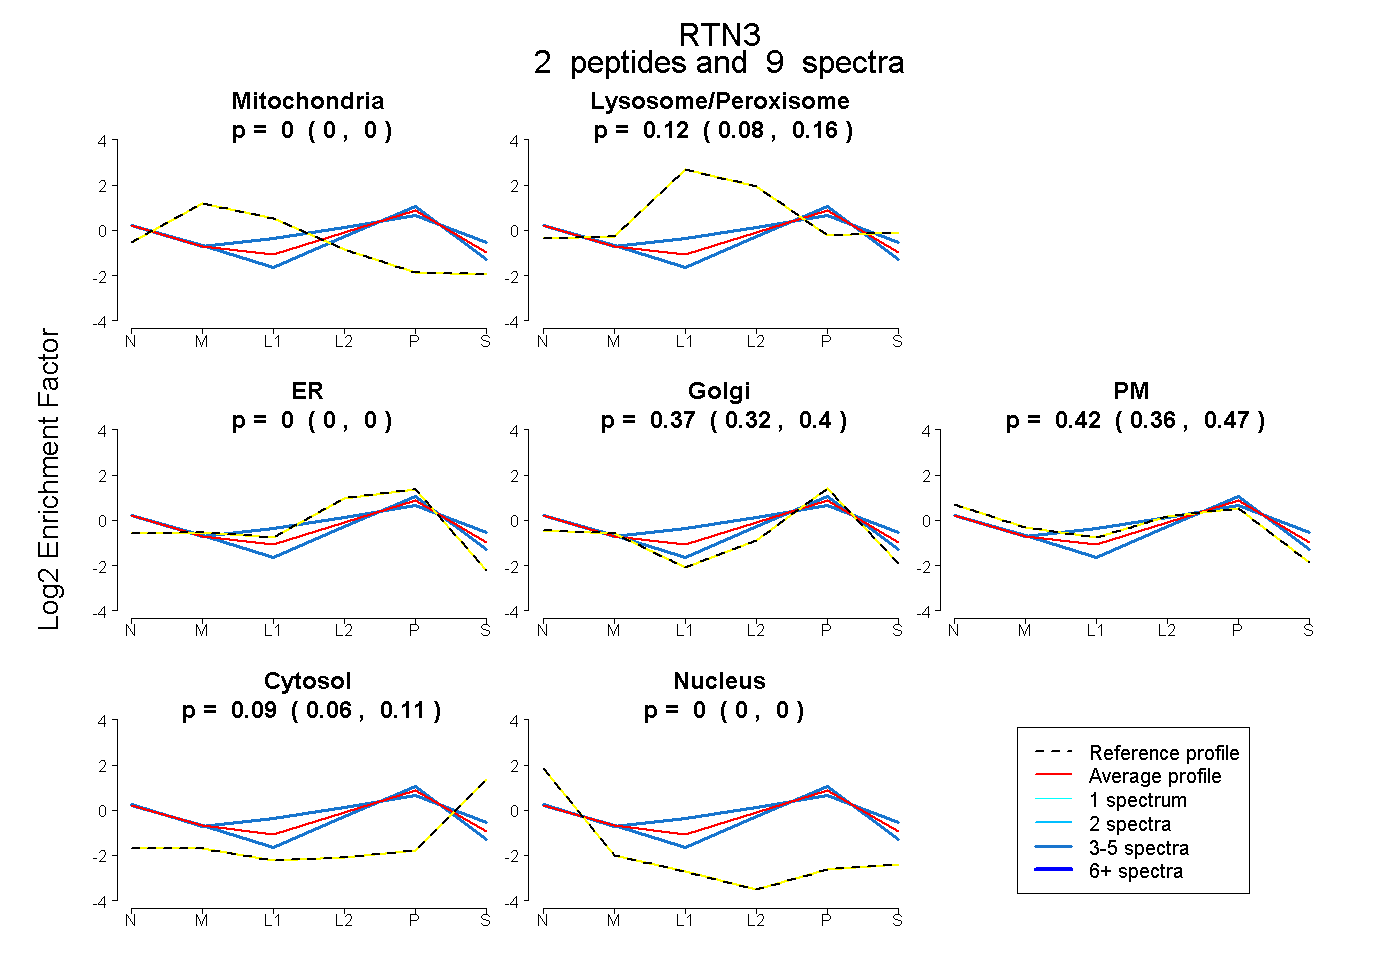 |
0.000 0.000 | 0.000 |
0.123 0.075 | 0.162 |
0.000 0.000 | 0.000 |
0.366 0.322 | 0.402 |
0.421 0.363 | 0.470 |
0.090 0.062 | 0.113 |
0.000 0.000 | 0.000 |
|||
| Plot | Lyso | Other | |||||||||||
| Expt C |
3 peptides |
24 spectra |
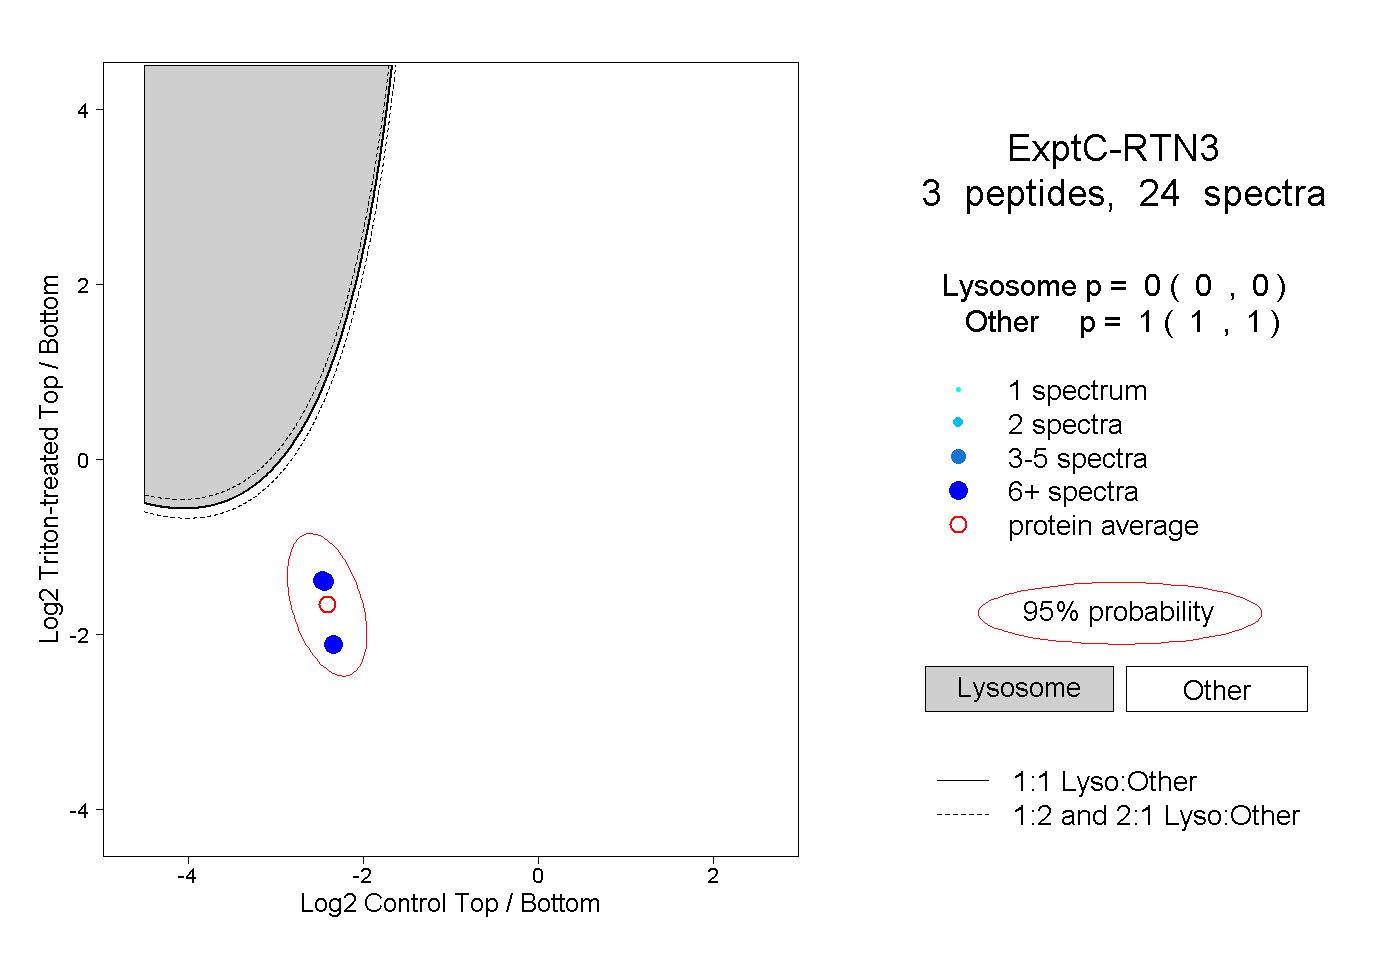 |
0.000 0.000 | 0.000 |
1.000 1.000 | 1.000 |