 4
4peptides
spectra
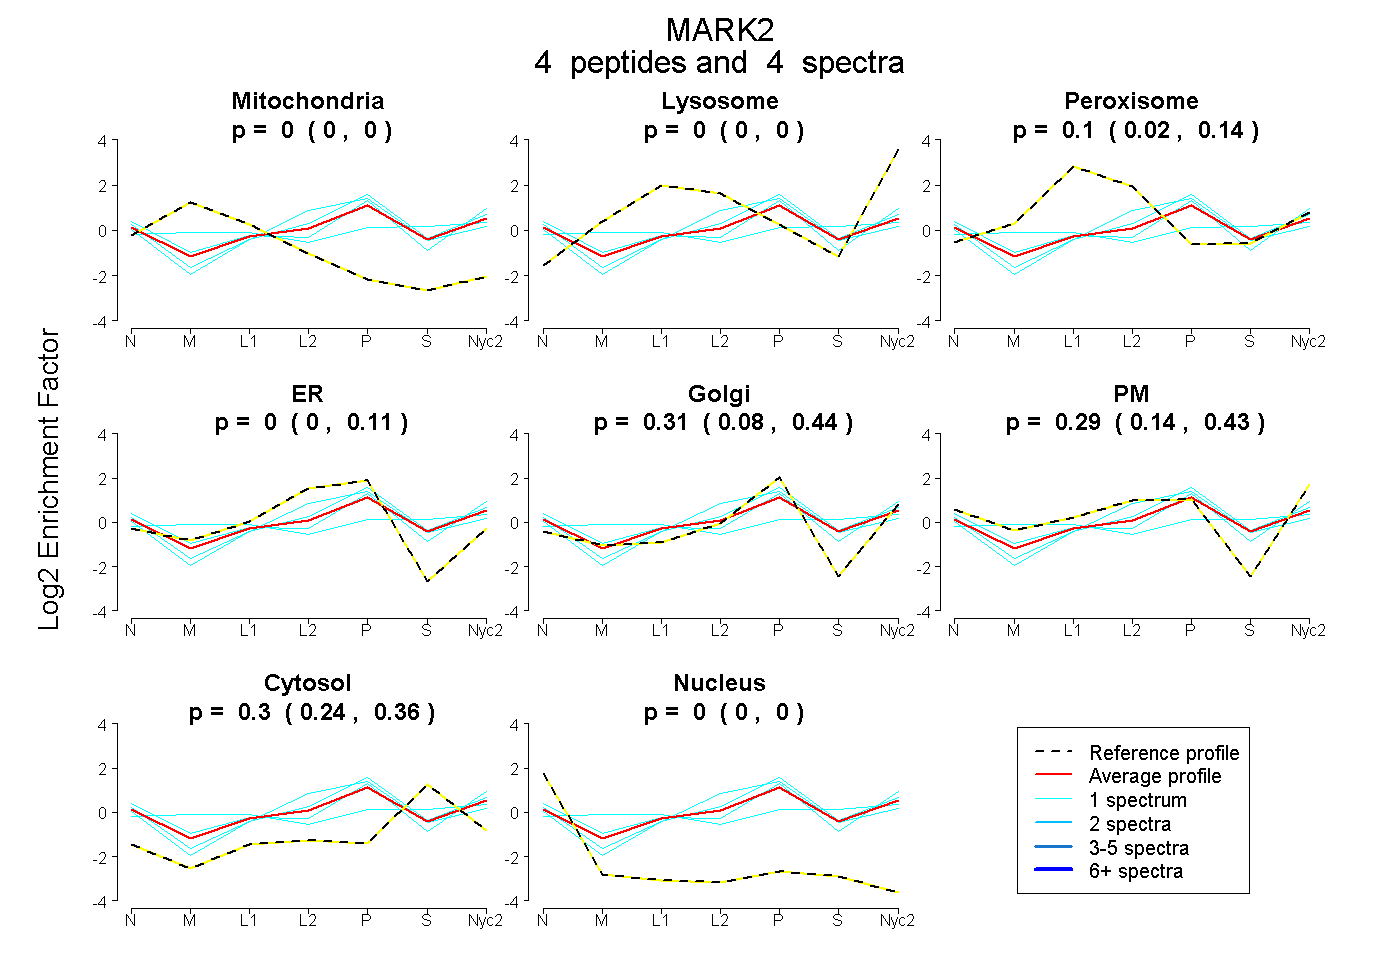
0.000 | 0.000
0.000 | 0.000
0.017 | 0.144
0.000 | 0.113
0.080 | 0.436
0.143 | 0.430
0.243 | 0.358
0.000 | 0.000
2peptides
spectra
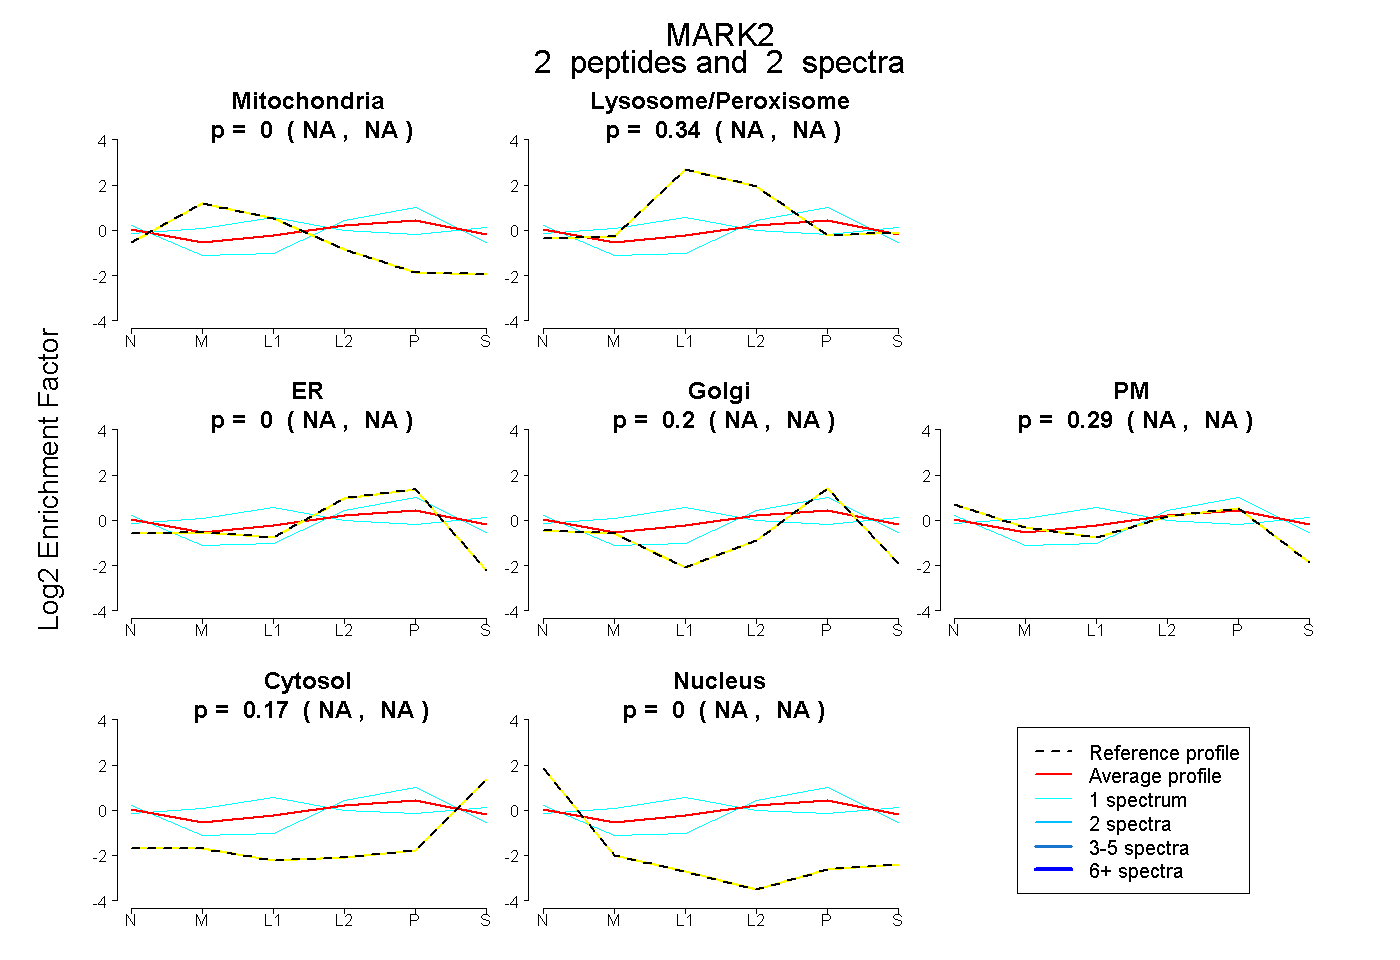
NA | NA
NA | NA
NA | NA
NA | NA
NA | NA
NA | NA
NA | NA
3peptides
spectra
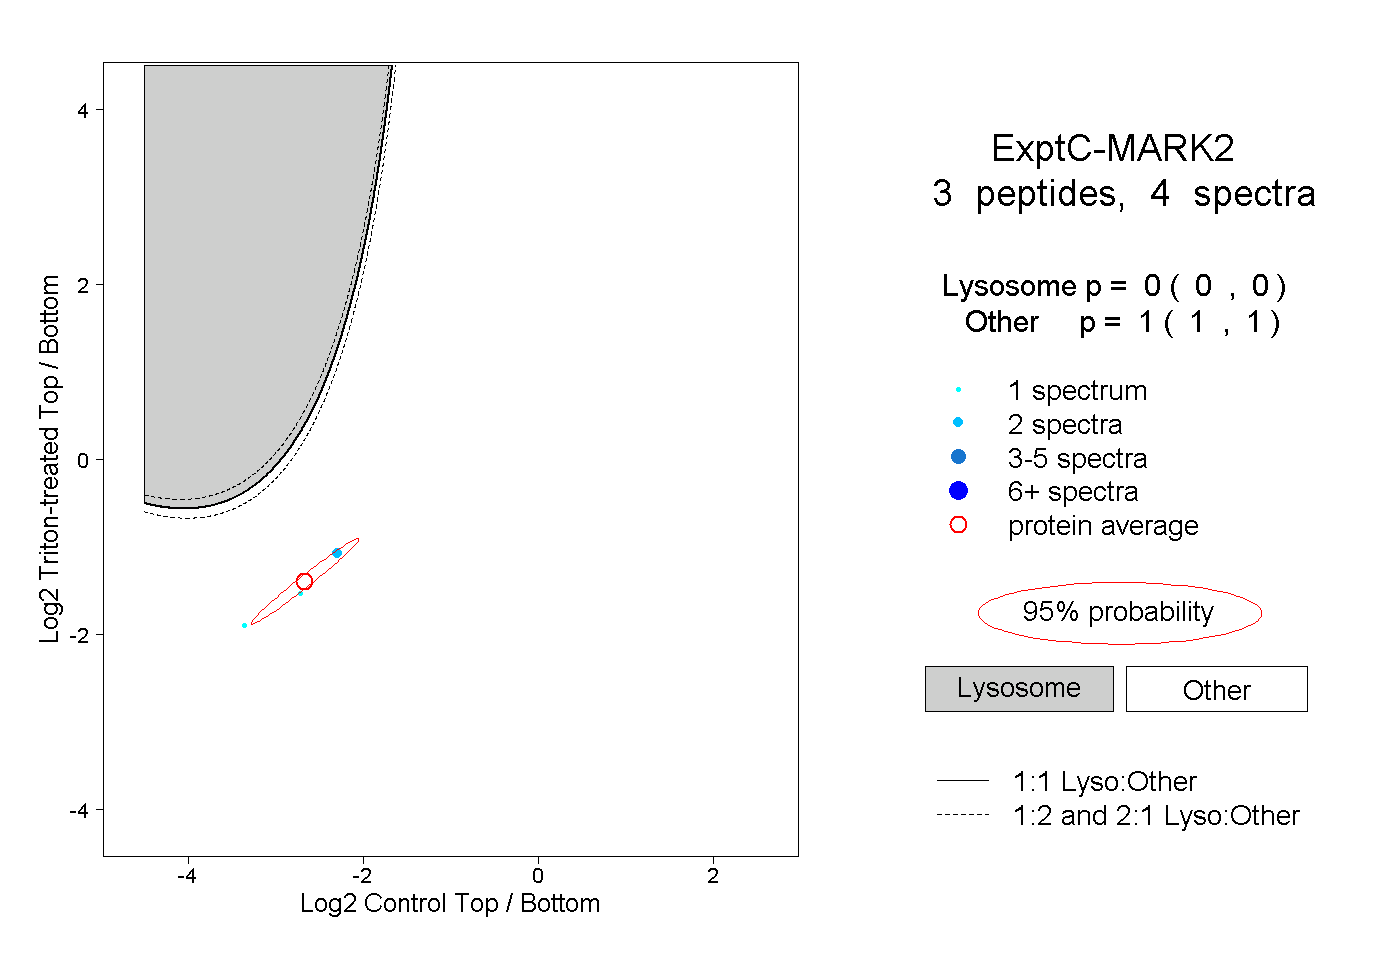
0.000 | 0.000
1.000 | 1.000