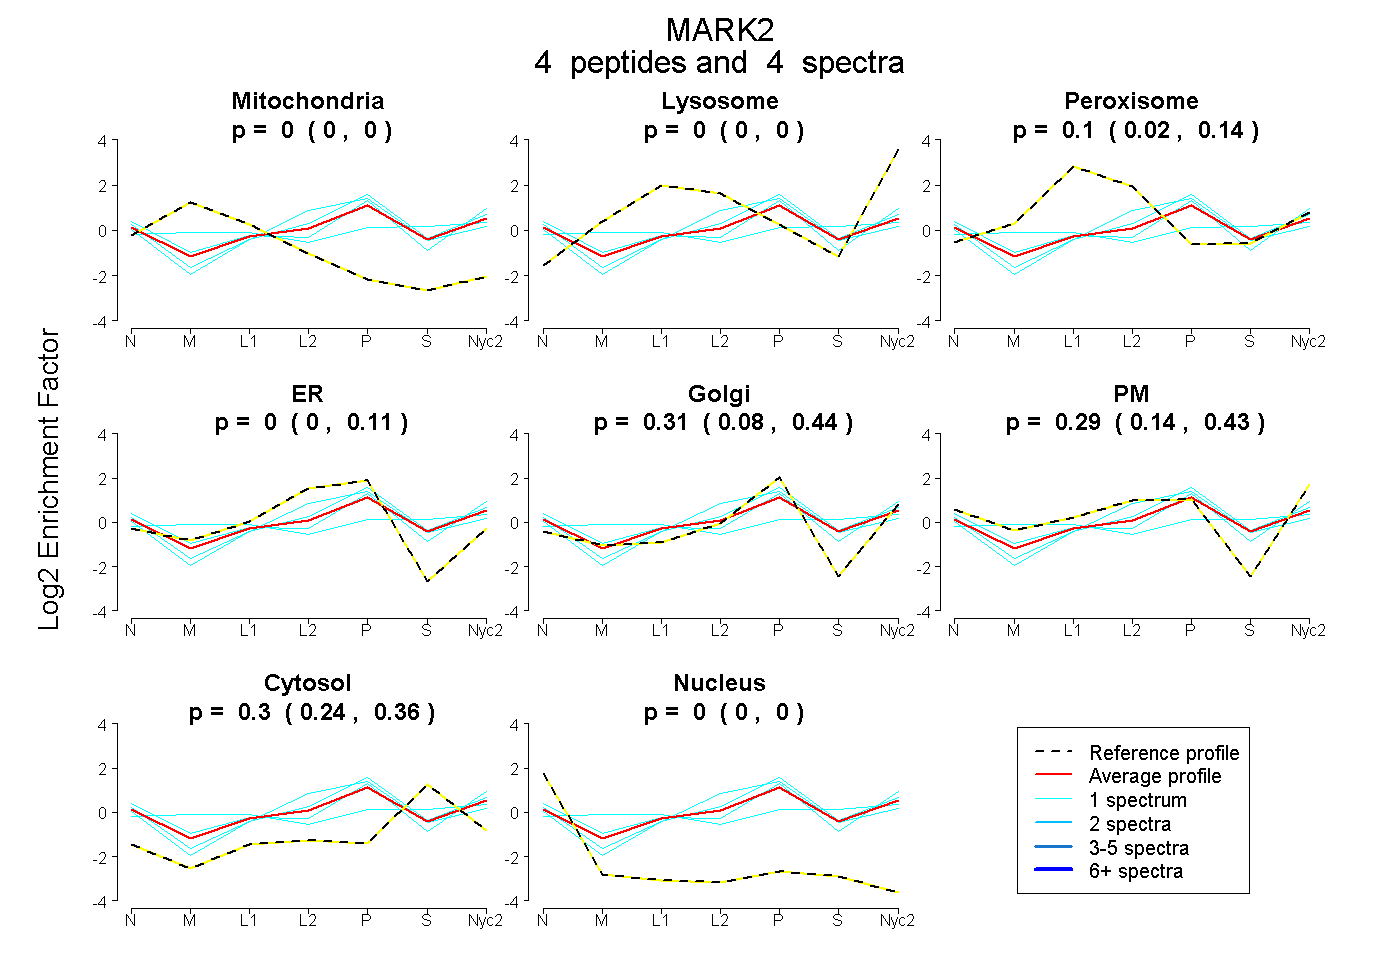
 4
4peptides
spectra
0.000 | 0.000
0.000 | 0.000
0.017 | 0.144
0.000 | 0.113
0.080 | 0.436
0.143 | 0.430
0.243 | 0.358
0.000 | 0.000
| Plot | Mito | Lyso | Perox | ER | Golgi | PM | Cytosol | Nucleus | |||||
| Expt A |
4 peptides |
4 spectra |
|
0.000 0.000 | 0.000 |
0.000 0.000 | 0.000 |
0.099 0.017 | 0.144 |
0.000 0.000 | 0.113 |
0.315 0.080 | 0.436 |
0.288 0.143 | 0.430 |
0.299 0.243 | 0.358 |
0.000 0.000 | 0.000 |
| 1 spectrum, TPLPTLNER | 0.000 | 0.010 | 0.000 | 0.104 | 0.336 | 0.241 | 0.308 | 0.000 | ||
| 1 spectrum, EEIQDSLVGQR | 0.093 | 0.066 | 0.147 | 0.000 | 0.102 | 0.207 | 0.385 | 0.000 | ||
| 1 spectrum, FLILNPSK | 0.000 | 0.000 | 0.000 | 0.436 | 0.000 | 0.251 | 0.314 | 0.000 | ||
| 1 spectrum, SVSANPK | 0.000 | 0.000 | 0.000 | 0.000 | 0.273 | 0.487 | 0.240 | 0.000 |
| Plot | Mito | Lyso or Perox | ER | Golgi | PM | Cytosol | Nucleus | ||||||
| Expt B |
2 peptides |
2 spectra |
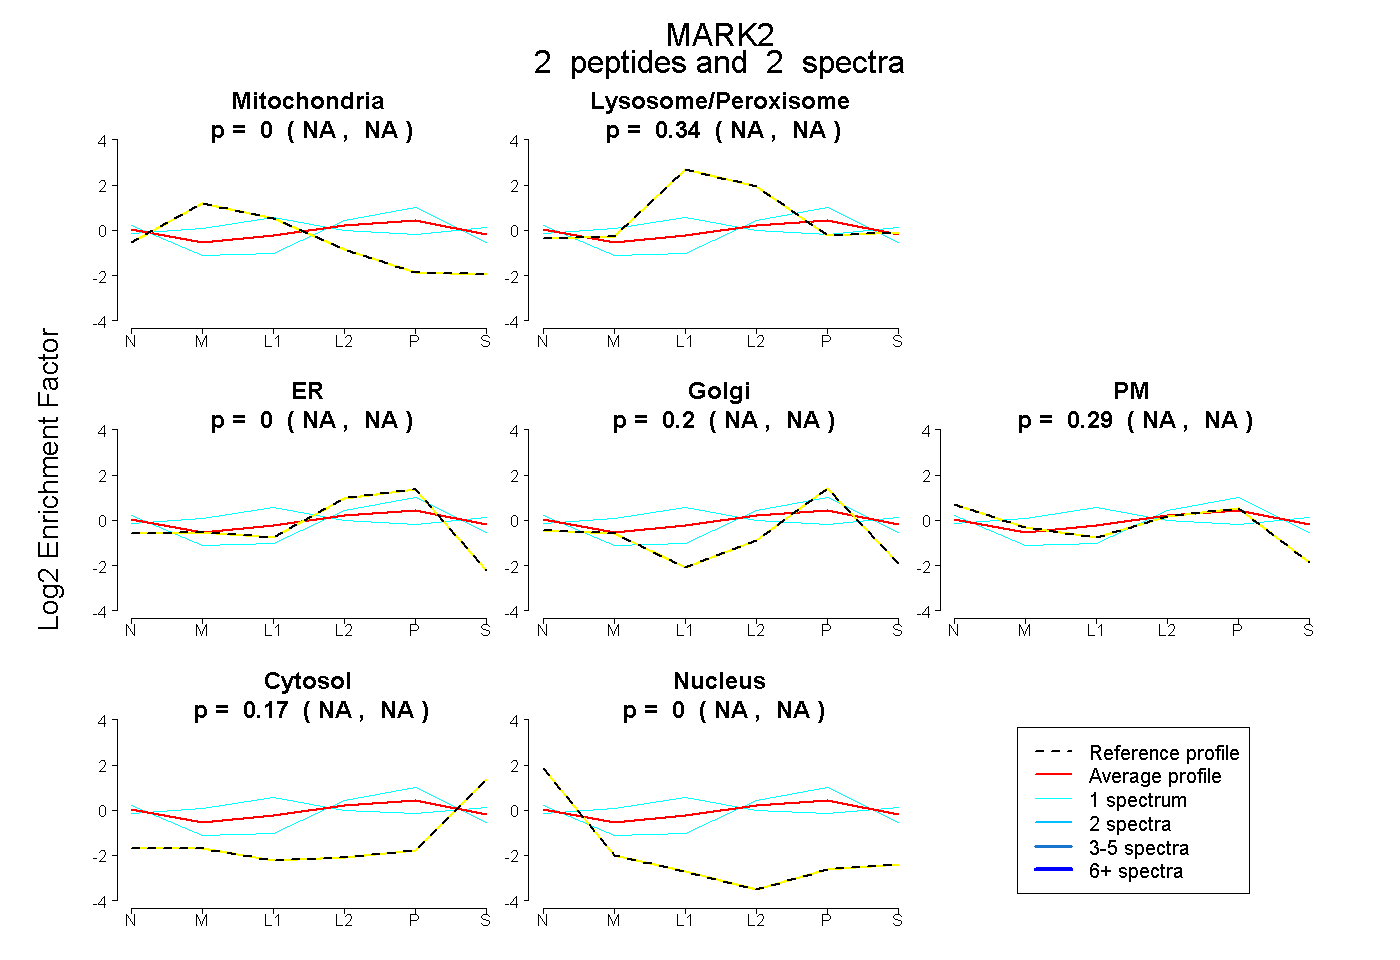 |
0.000 NA | NA |
0.336 NA | NA |
0.000 NA | NA |
0.199 NA | NA |
0.291 NA | NA |
0.174 NA | NA |
0.000 NA | NA |
|||
| Plot | Lyso | Other | |||||||||||
| Expt C |
3 peptides |
4 spectra |
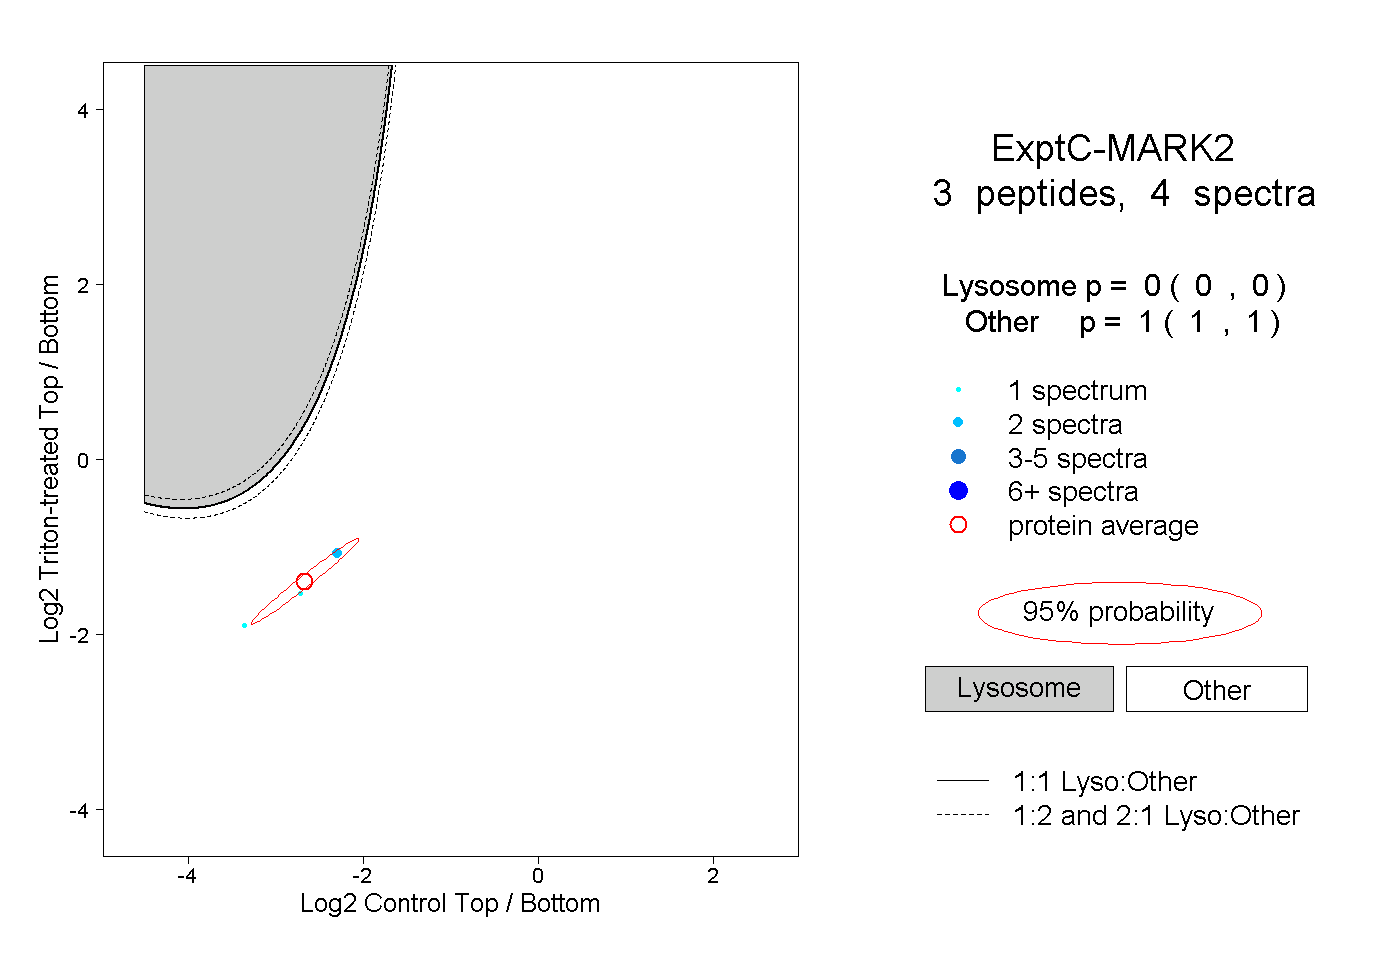 |
0.000 0.000 | 0.000 |
1.000 1.000 | 1.000 |